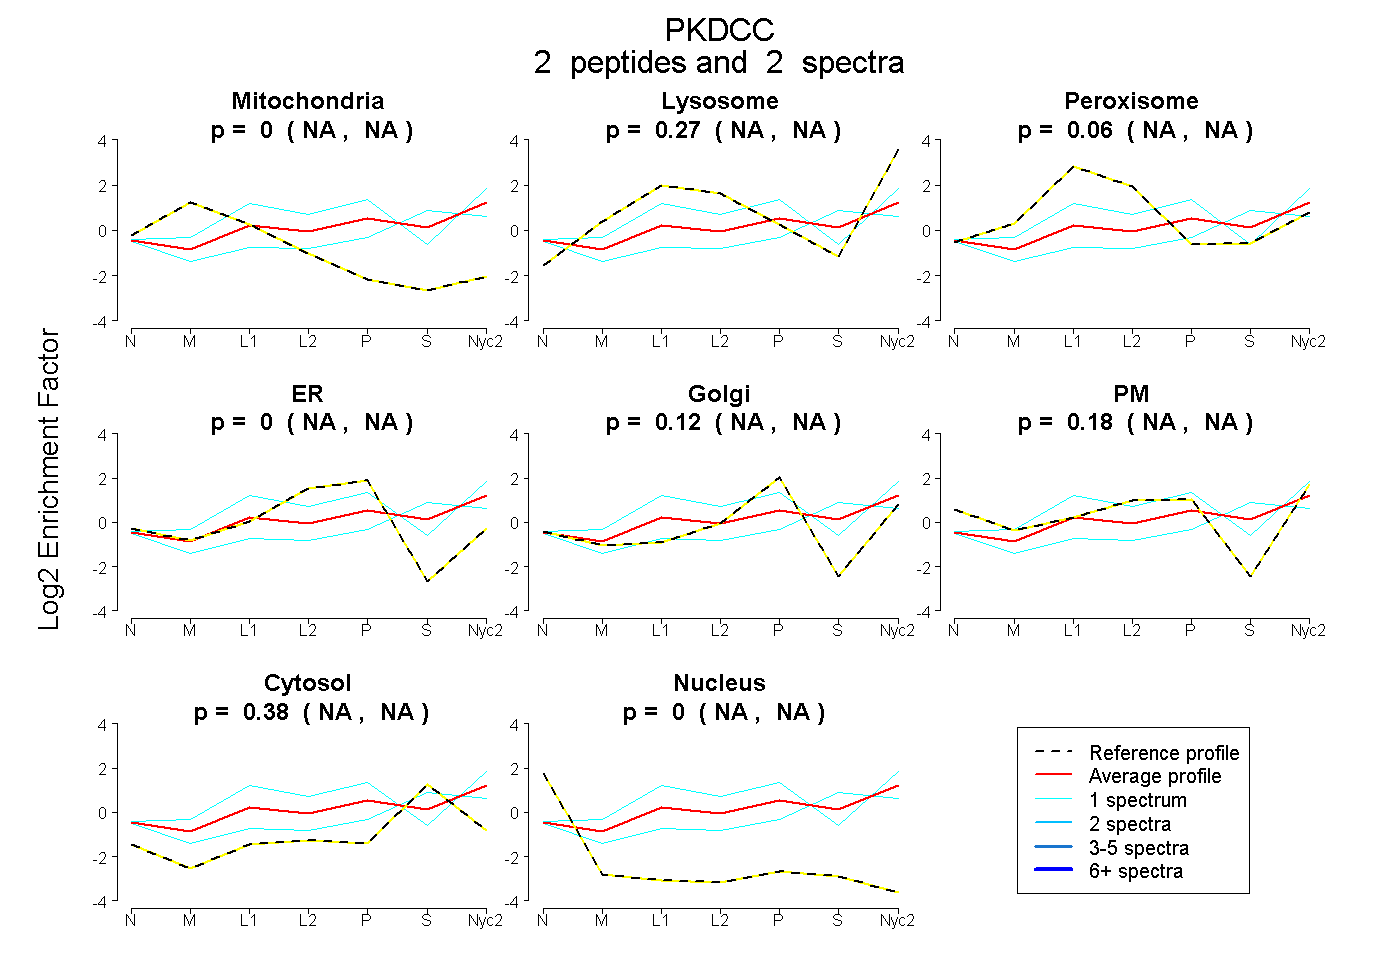
 2
2peptides
spectra
NA | NA
NA | NA
NA | NA
NA | NA
NA | NA
NA | NA
NA | NA
NA | NA
| Plot | Mito | Lyso | Perox | ER | Golgi | PM | Cytosol | Nucleus | |||||
| Expt A |
2 peptides |
2 spectra |
|
0.000 NA | NA |
0.266 NA | NA |
0.058 NA | NA |
0.000 NA | NA |
0.115 NA | NA |
0.181 NA | NA |
0.380 NA | NA |
0.000 NA | NA |
| 1 spectrum, IPDSTITQEDYR | 0.000 | 0.339 | 0.240 | 0.000 | 0.381 | 0.000 | 0.040 | 0.000 | ||
| 1 spectrum, VLLER | 0.000 | 0.136 | 0.000 | 0.000 | 0.000 | 0.195 | 0.669 | 0.000 |
| Plot | Lyso | Other | |||||||||||
| Expt C |
1 peptide |
35 spectra |
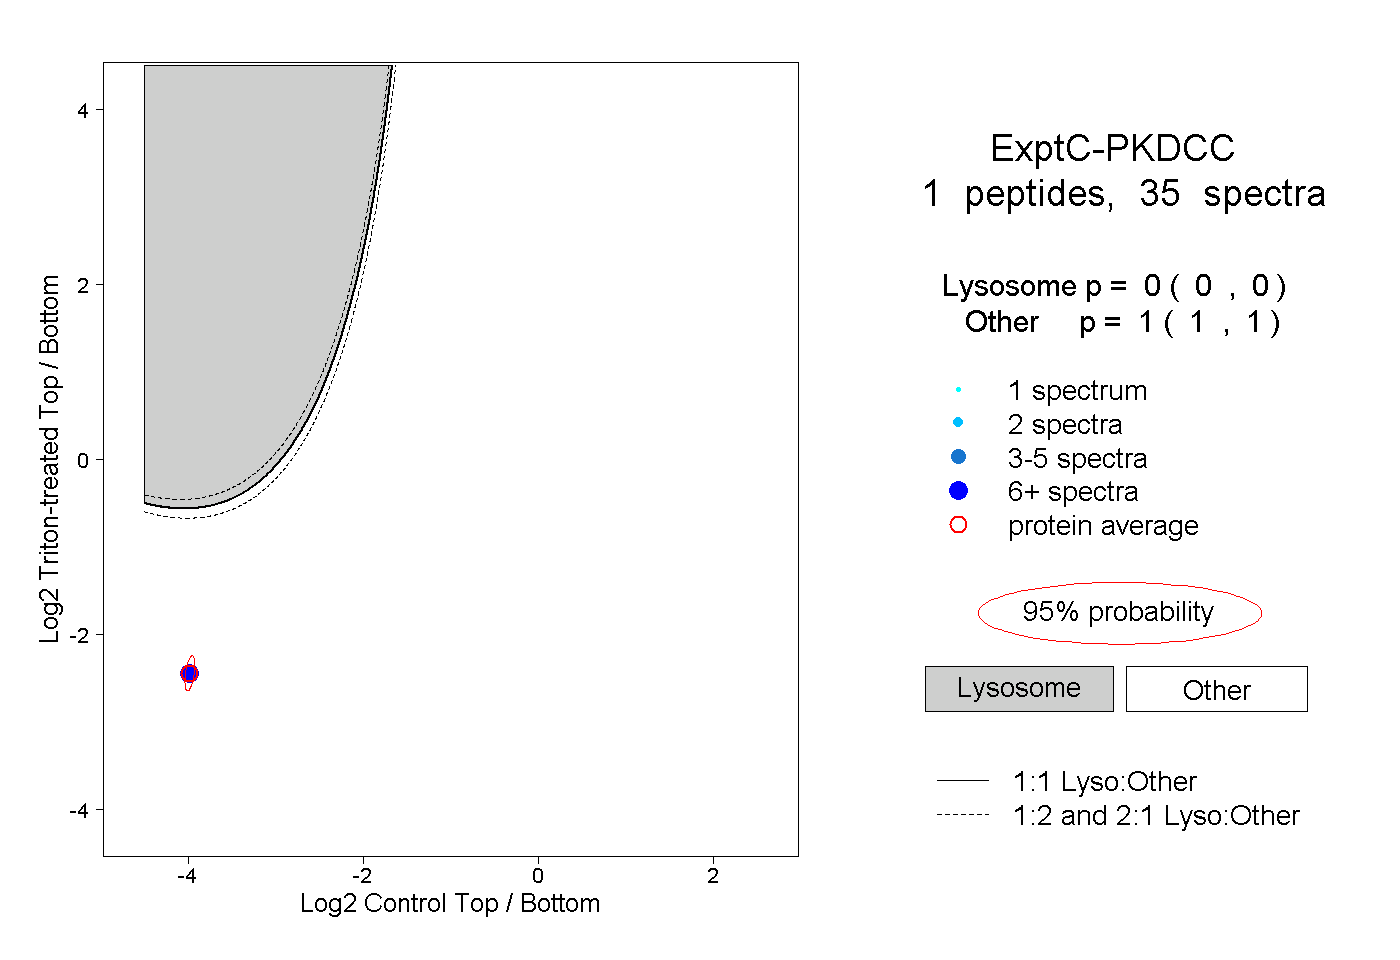 |
0.000 0.000 | 0.000 |
1.000 1.000 | 1.000 |