 2
2peptides
spectra
0.000 | 0.450
0.000 | 0.114
0.000 | 0.268
0.000 | 0.175
0.000 | 0.000
0.000 | 0.008
0.409 | 0.687
0.000 | 0.155
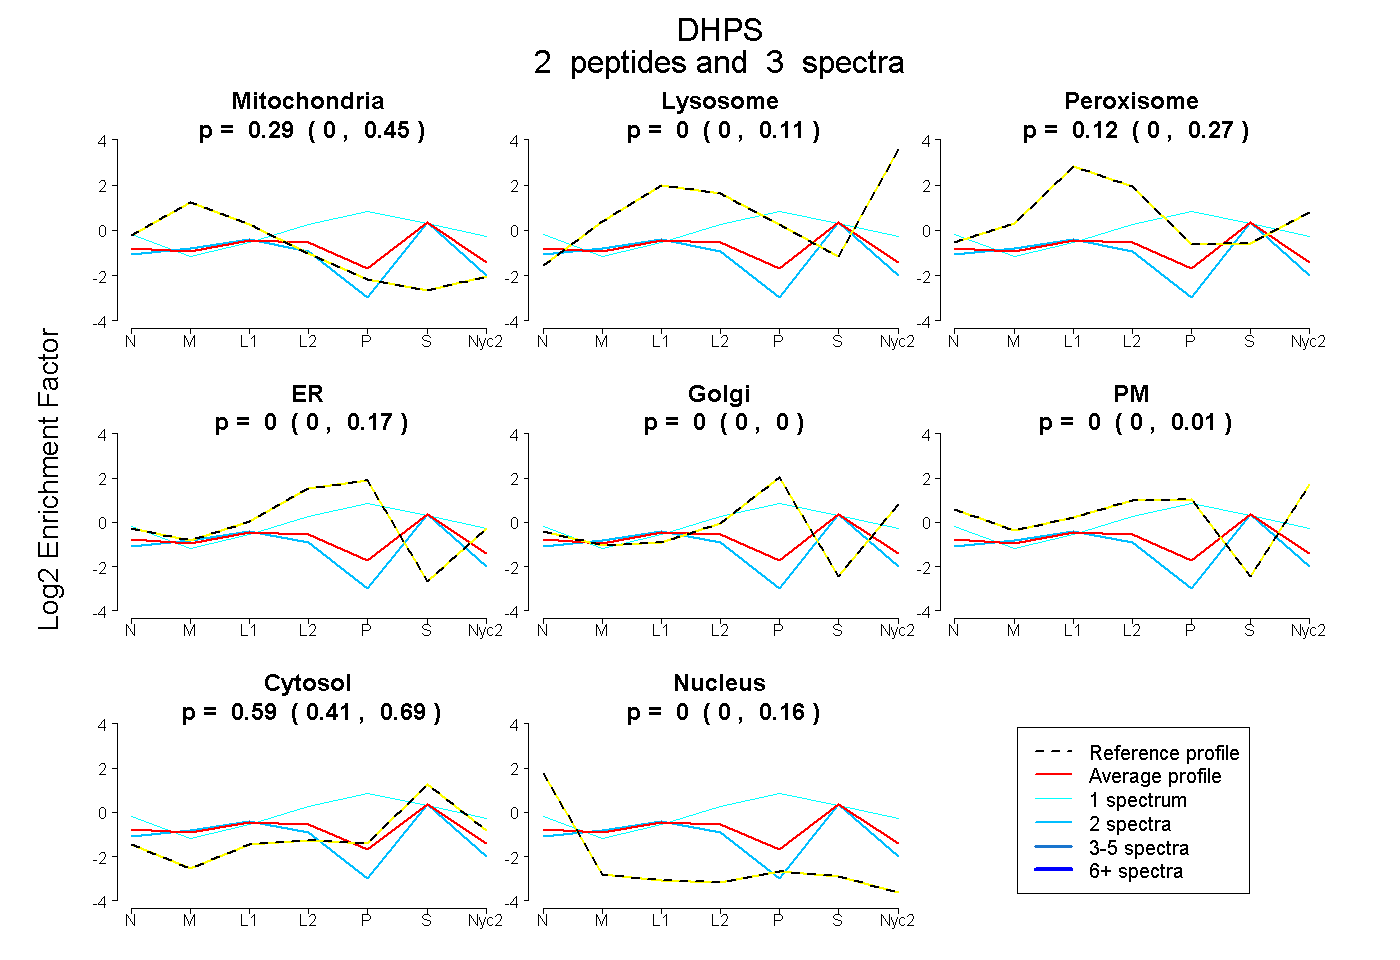
| Plot | Mito | Lyso | Perox | ER | Golgi | PM | Cytosol | Nucleus | |||||
| Expt A |
2 peptides |
3 spectra |
|
0.285 0.000 | 0.450 |
0.000 0.000 | 0.114 |
0.121 0.000 | 0.268 |
0.000 0.000 | 0.175 |
0.000 0.000 | 0.000 |
0.000 0.000 | 0.008 |
0.594 0.409 | 0.687 |
0.000 0.000 | 0.155 |
| 2 spectra, NPGLVLDIVEDLR | 0.415 | 0.000 | 0.000 | 0.000 | 0.000 | 0.000 | 0.585 | 0.000 | ||
| 1 spectrum, HHIANANLMR | 0.000 | 0.000 | 0.106 | 0.289 | 0.109 | 0.046 | 0.449 | 0.000 |