MON2
[ENSRNOP00000005654]
Main page
| | | Plot |
Mito |
Lyso |
|
Perox |
ER |
Golgi |
PM |
Cytosol |
Nucleus |
|
| Expt A |
 25
25
peptides |
47
spectra |
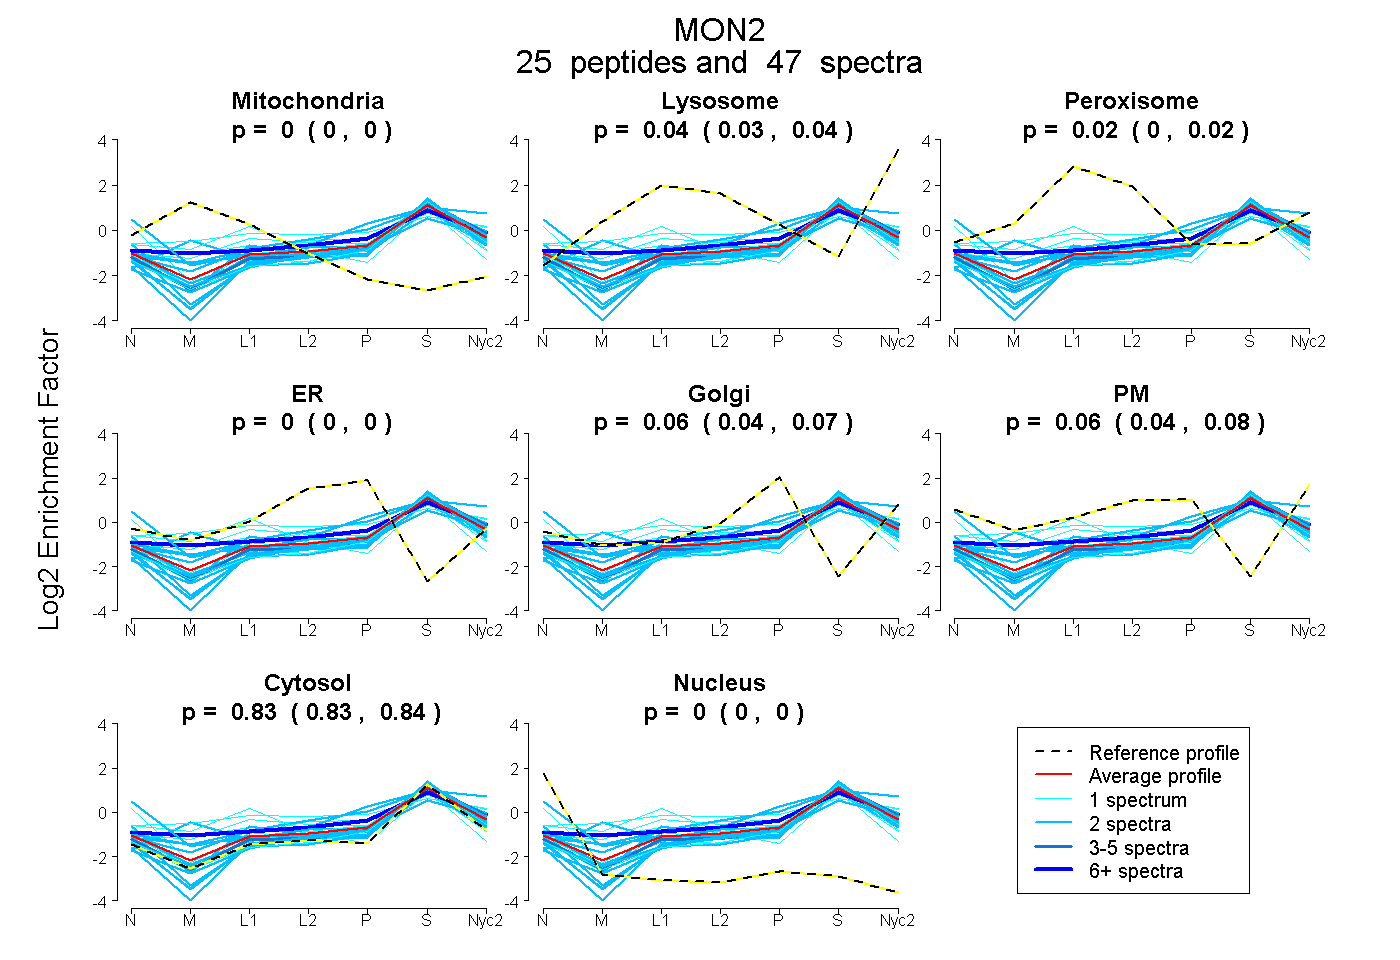 |
0.000
0.000 | 0.000 |
0.037
0.028 | 0.045 |
|
0.016
0.005 | 0.024 |
0.000
0.000 | 0.000 |
0.055
0.040 | 0.068 |
0.059
0.038 | 0.078 |
0.833
0.828 | 0.838 |
0.000
0.000 | 0.000 |
|
| | | Plot |
Mito |
|
Lyso or Perox |
|
ER |
Golgi |
PM |
Cytosol |
Nucleus |
|
| Expt B |
6
peptides |
9
spectra |
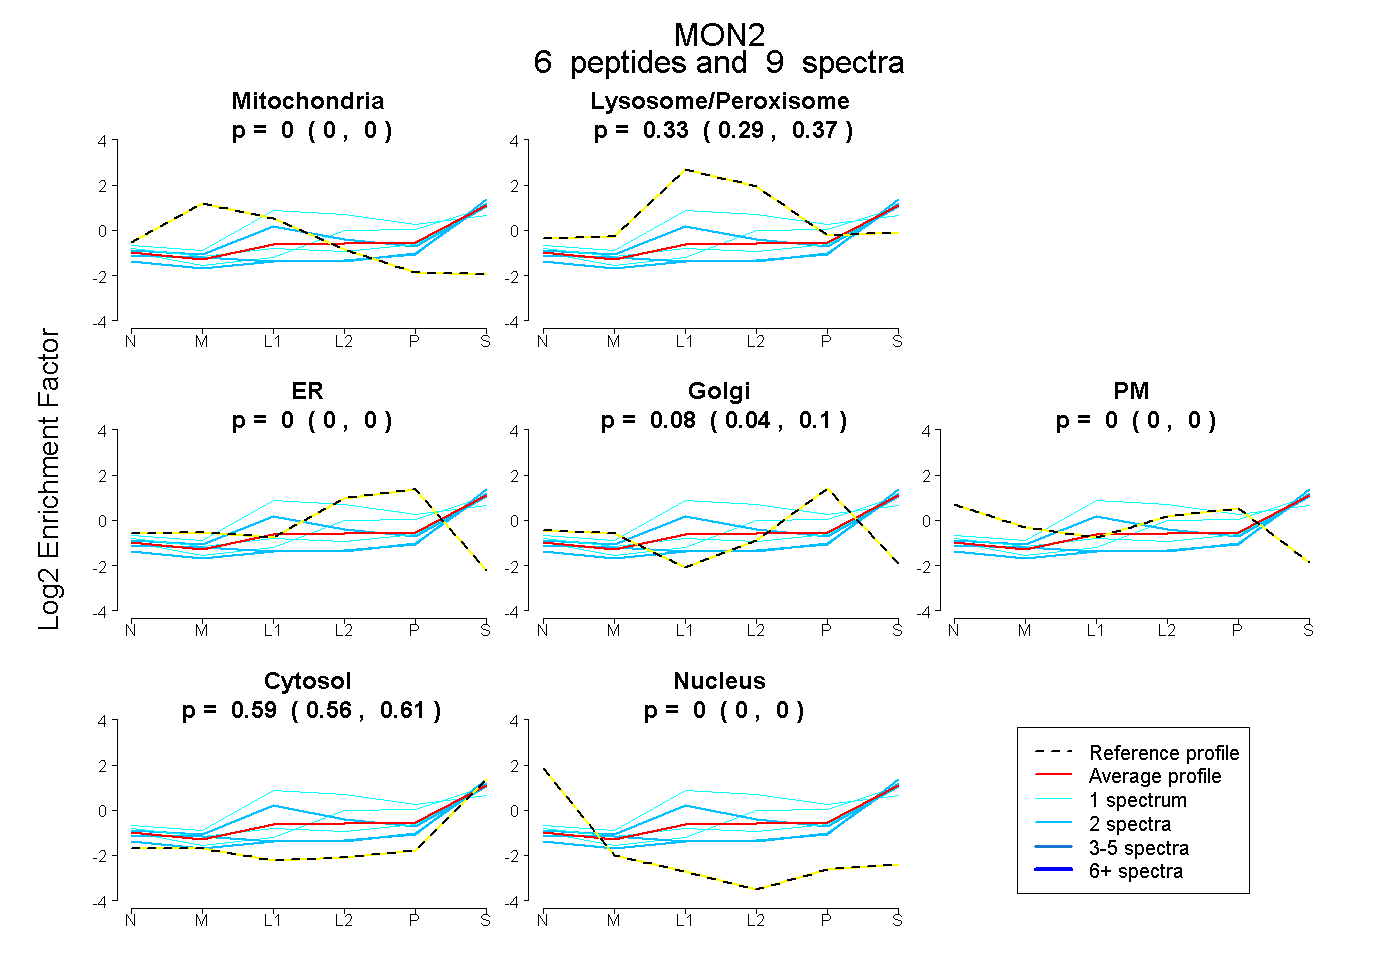 |
0.000
0.000 | 0.000 |
|
0.334
0.294 | 0.366 |
|
0.000
0.000 | 0.000 |
0.079
0.040 | 0.104 |
0.000
0.000 | 0.000 |
0.586
0.560 | 0.611 |
0.000
0.000 | 0.000 |
|
| 1 spectrum, LLETGLVNMHR |
0.000 |
|
0.635 |
|
0.000 |
0.119 |
0.000 |
0.246 |
0.000 |
|
| 1 spectrum, QVVTVVFER |
0.000 |
|
0.197 |
|
0.248 |
0.000 |
0.000 |
0.555 |
0.000 |
|
| 2 spectra, YLLQPLGDFSR |
0.000 |
|
0.169 |
|
0.000 |
0.069 |
0.013 |
0.749 |
0.000 |
|
| 2 spectra, VLFHLLDR |
0.000 |
|
0.172 |
|
0.000 |
0.017 |
0.000 |
0.810 |
0.000 |
|
| 2 spectra, VTQLCLAAIQR |
0.000 |
|
0.464 |
|
0.000 |
0.000 |
0.000 |
0.536 |
0.000 |
|
| 1 spectrum, VTTPQEGYISR |
0.000 |
|
0.277 |
|
0.000 |
0.082 |
0.022 |
0.619 |
0.000 |
|
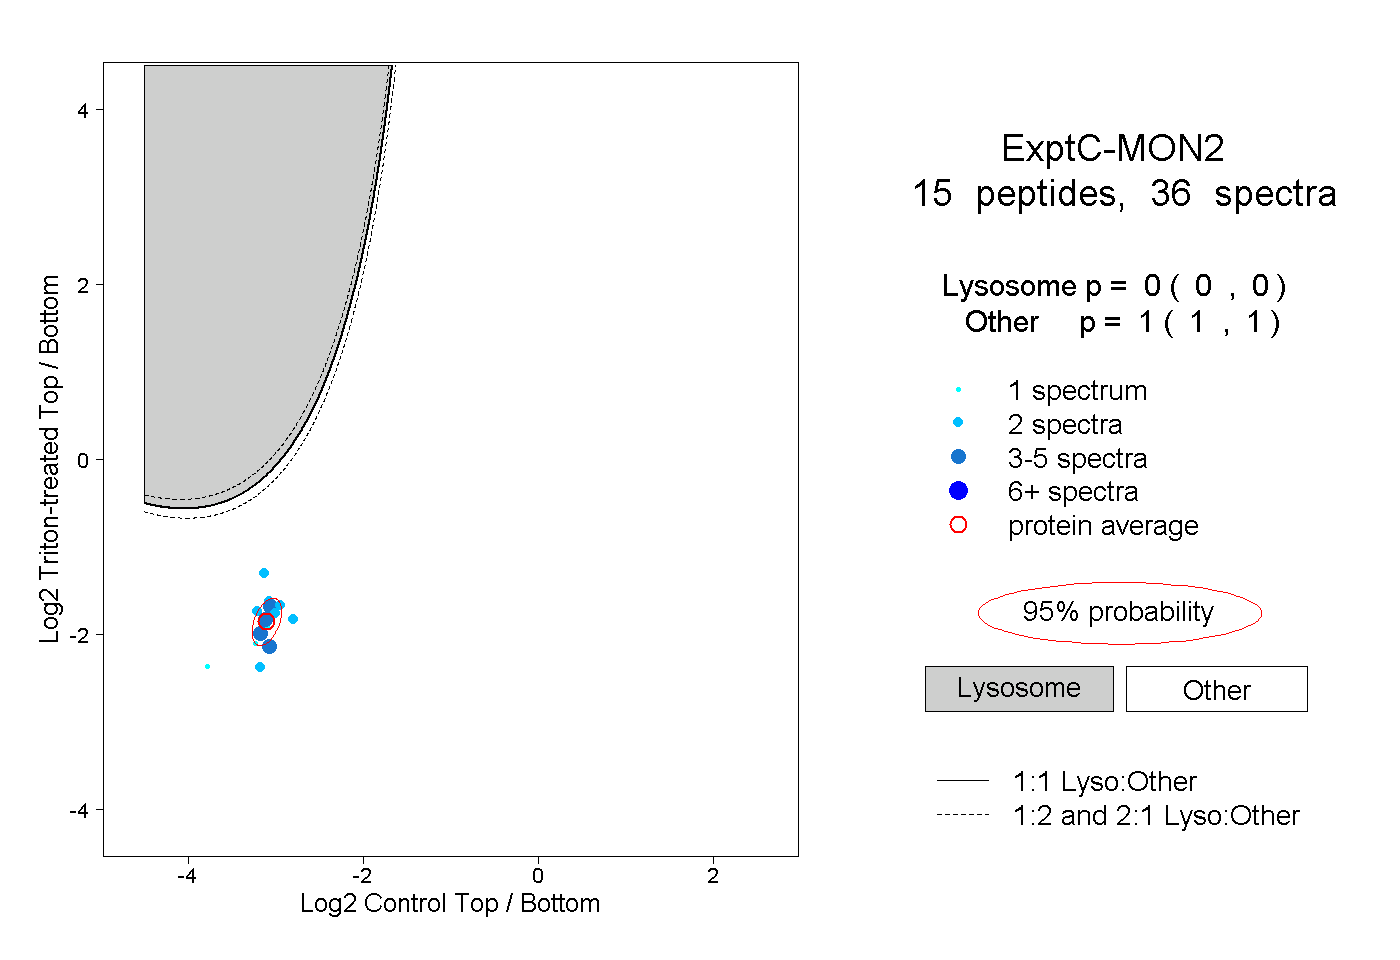
| | | Plot |
|
Lyso |
|
|
|
|
|
|
|
Other |
| Expt C |
15
peptides |
36
spectra |
 |
|
0.000
0.000 | 0.000 |
|
|
|
|
|
|
|
1.000
1.000 | 1.000 |
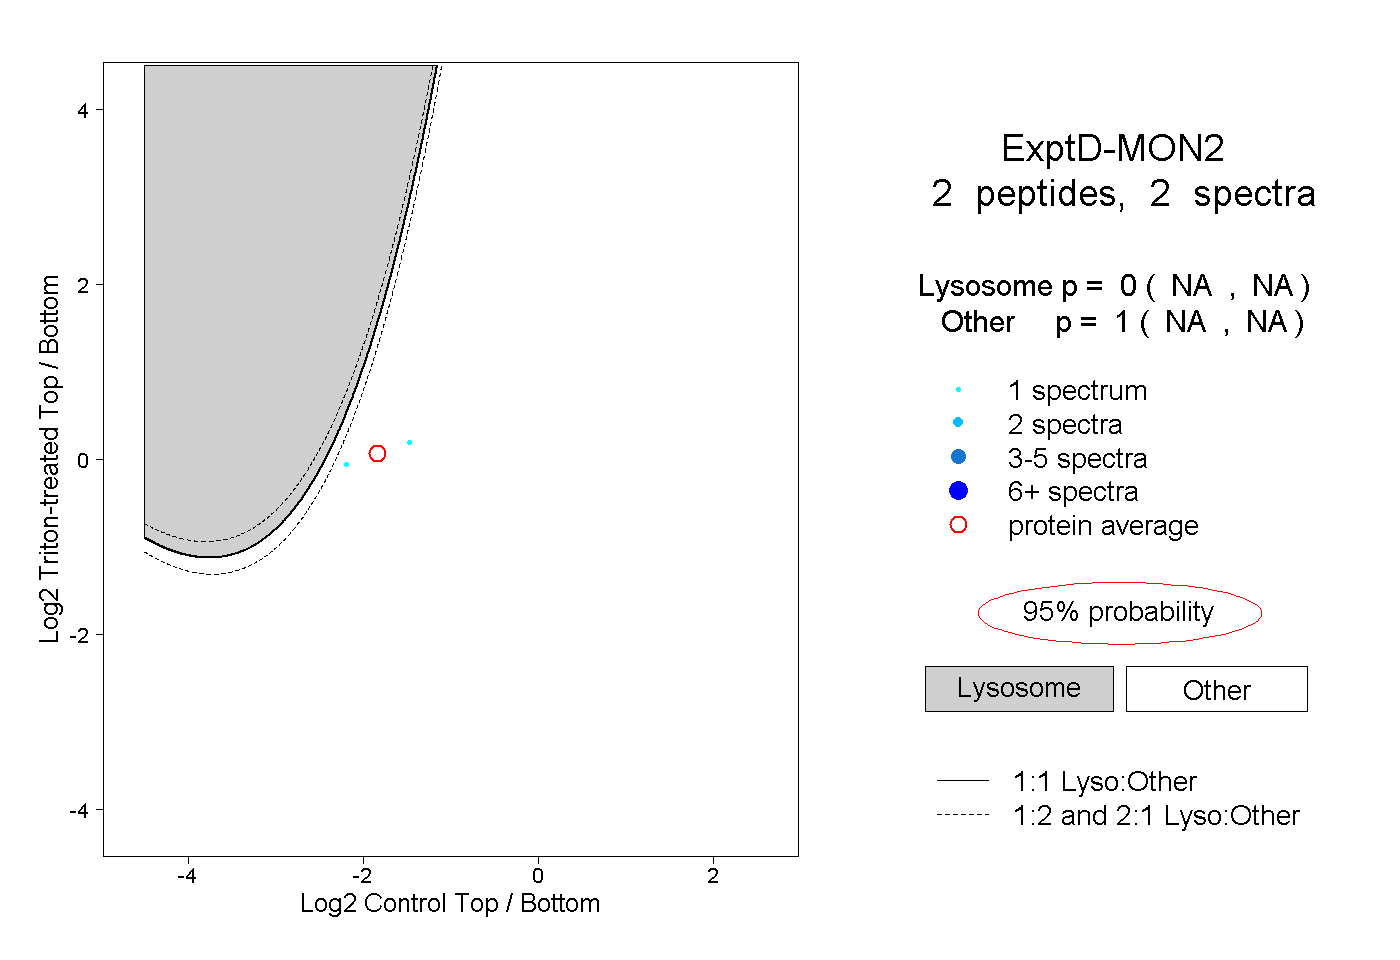
| | | Plot |
|
Lyso |
|
|
|
|
|
|
|
Other |
| Expt D |
2
peptides |
2
spectra |
 |
|
0.000
NA | NA |
|
|
|
|
|
|
|
1.000
NA | NA |