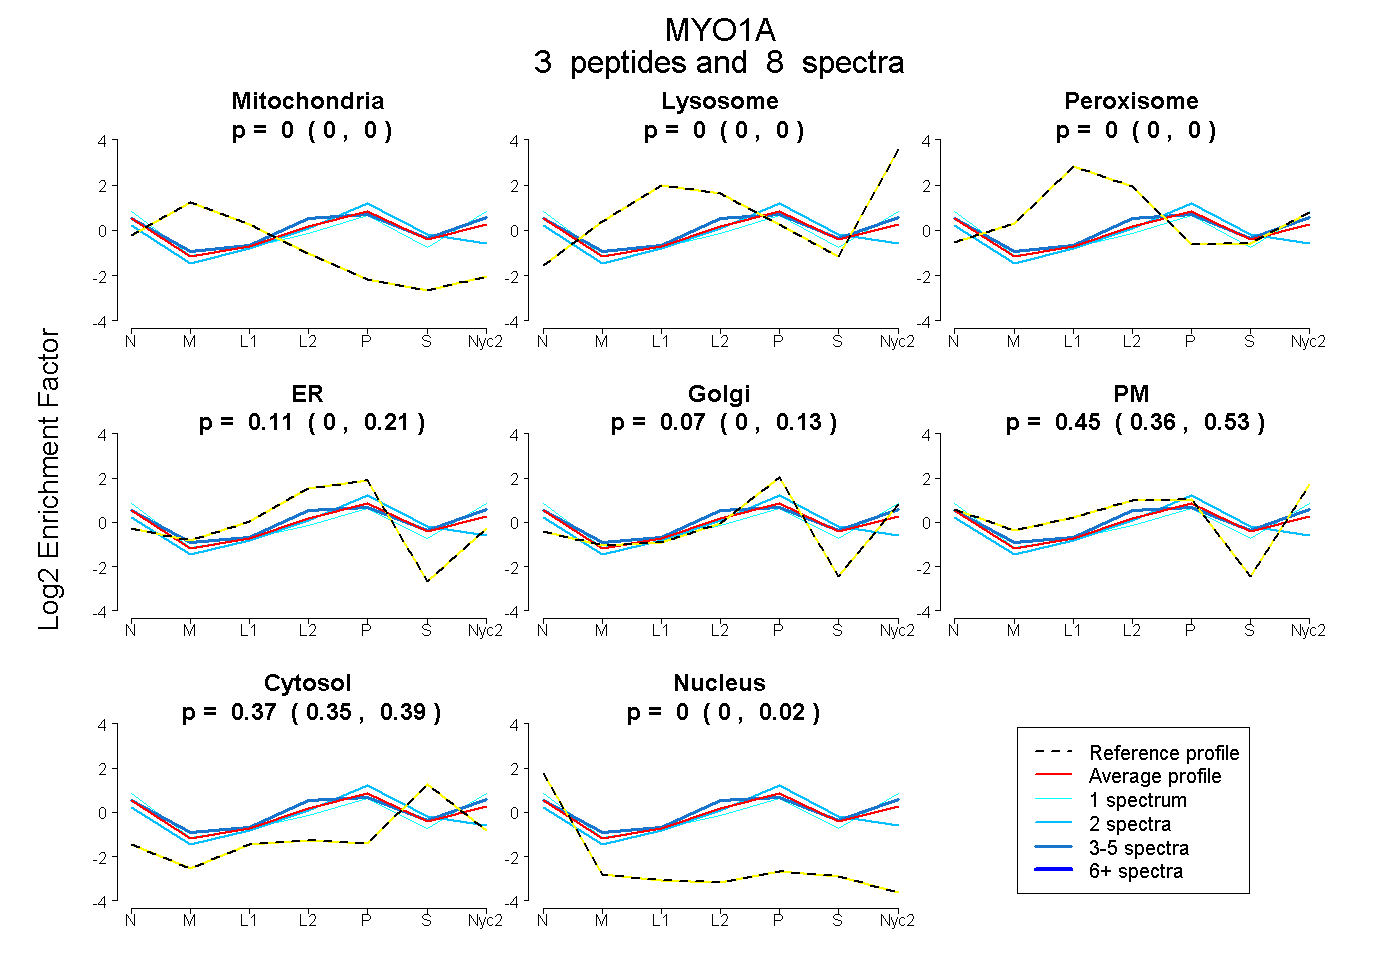
 3
3peptides
spectra
0.000 | 0.000
0.000 | 0.000
0.000 | 0.000
0.000 | 0.205
0.000 | 0.134
0.358 | 0.525
0.346 | 0.387
0.000 | 0.025
| Plot | Mito | Lyso | Perox | ER | Golgi | PM | Cytosol | Nucleus | |||||
| Expt A |
3 peptides |
8 spectra |
|
0.000 0.000 | 0.000 |
0.000 0.000 | 0.000 |
0.000 0.000 | 0.000 |
0.108 0.000 | 0.205 |
0.070 0.000 | 0.134 |
0.448 0.358 | 0.525 |
0.370 0.346 | 0.387 |
0.004 0.000 | 0.025 |
| 2 spectra, LEEDAR | 0.000 | 0.000 | 0.000 | 0.423 | 0.151 | 0.006 | 0.420 | 0.000 | ||
| 5 spectra, LNESLK | 0.000 | 0.000 | 0.000 | 0.053 | 0.000 | 0.596 | 0.351 | 0.000 | ||
| 1 spectrum, DQLSPK | 0.000 | 0.000 | 0.000 | 0.000 | 0.028 | 0.627 | 0.300 | 0.045 |
| Plot | Mito | Lyso or Perox | ER | Golgi | PM | Cytosol | Nucleus | ||||||
| Expt B |
1 peptide |
1 spectrum |
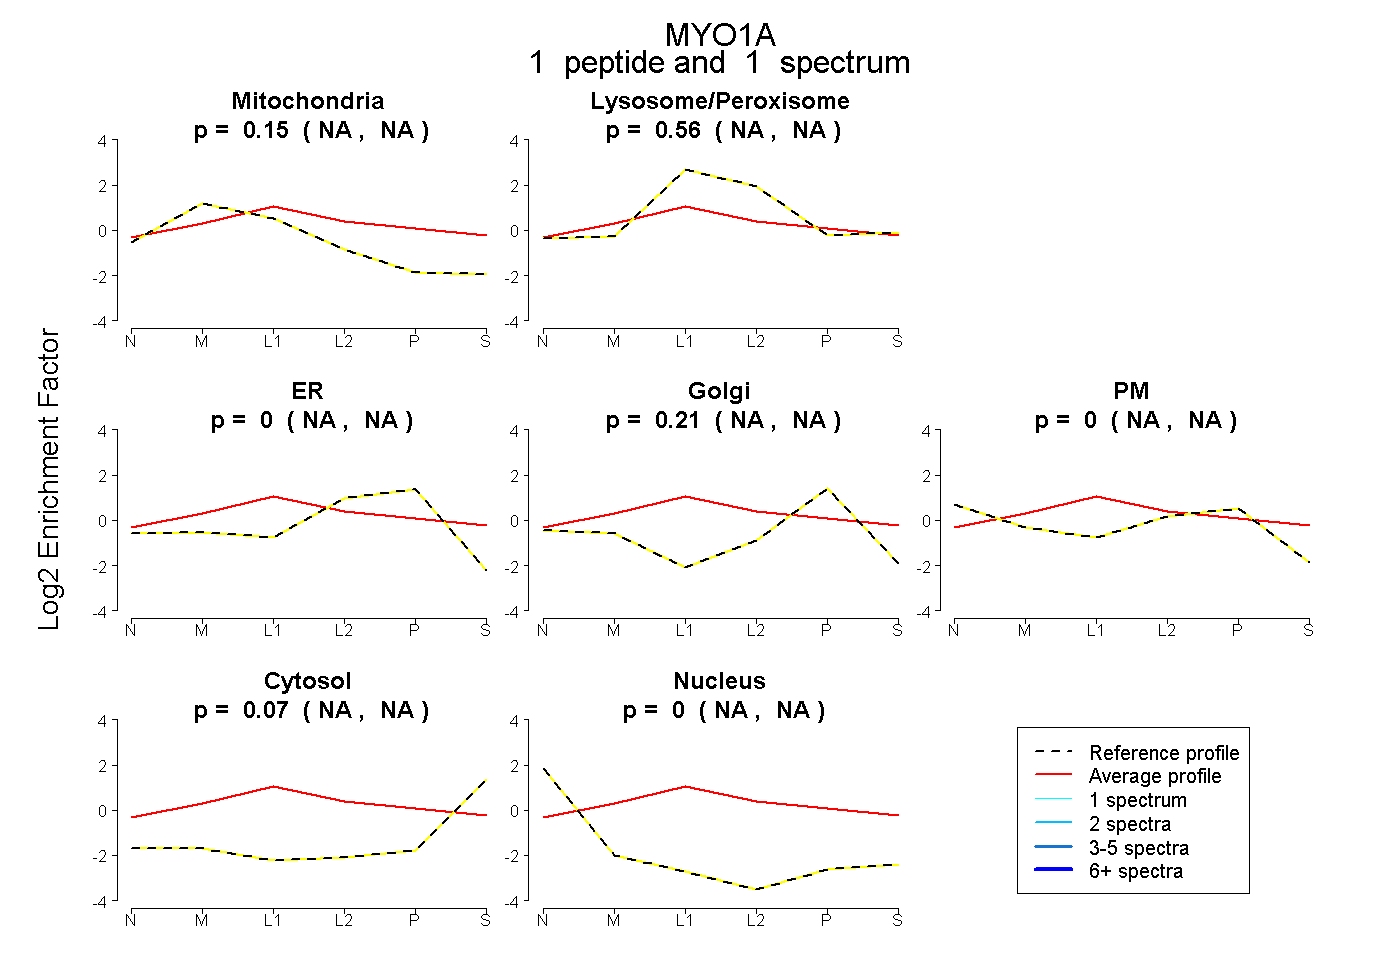 |
0.155 NA | NA |
0.563 NA | NA |
0.000 NA | NA |
0.211 NA | NA |
0.000 NA | NA |
0.070 NA | NA |
0.000 NA | NA |
|||
| Plot | Lyso | Other | |||||||||||
| Expt C |
3 peptides |
8 spectra |
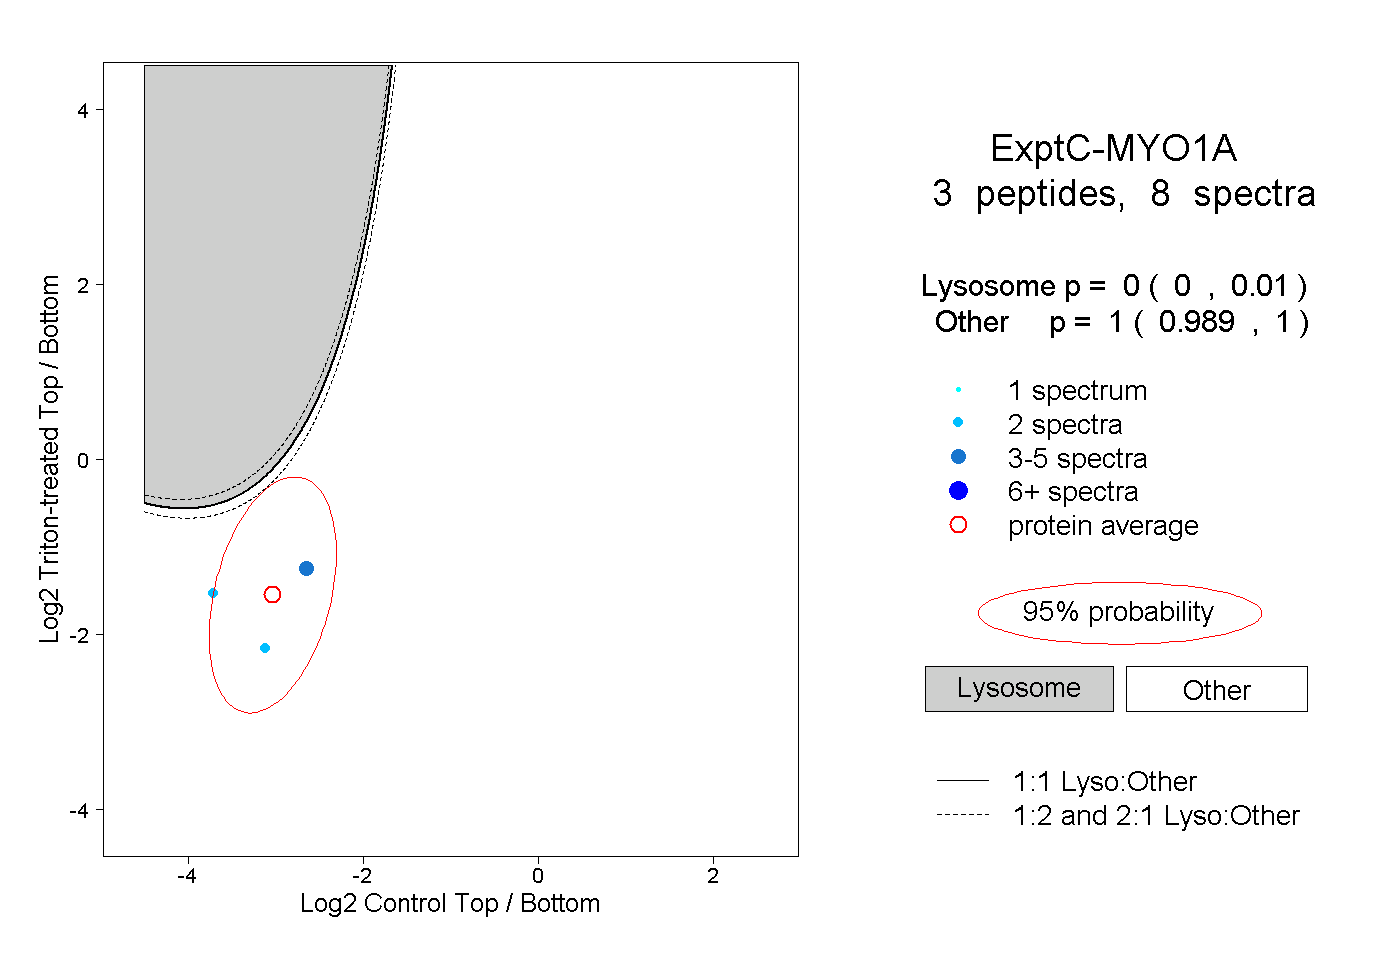 |
0.000 0.000 | 0.010 |
1.000 0.989 | 1.000 |