 8
8peptides
spectra
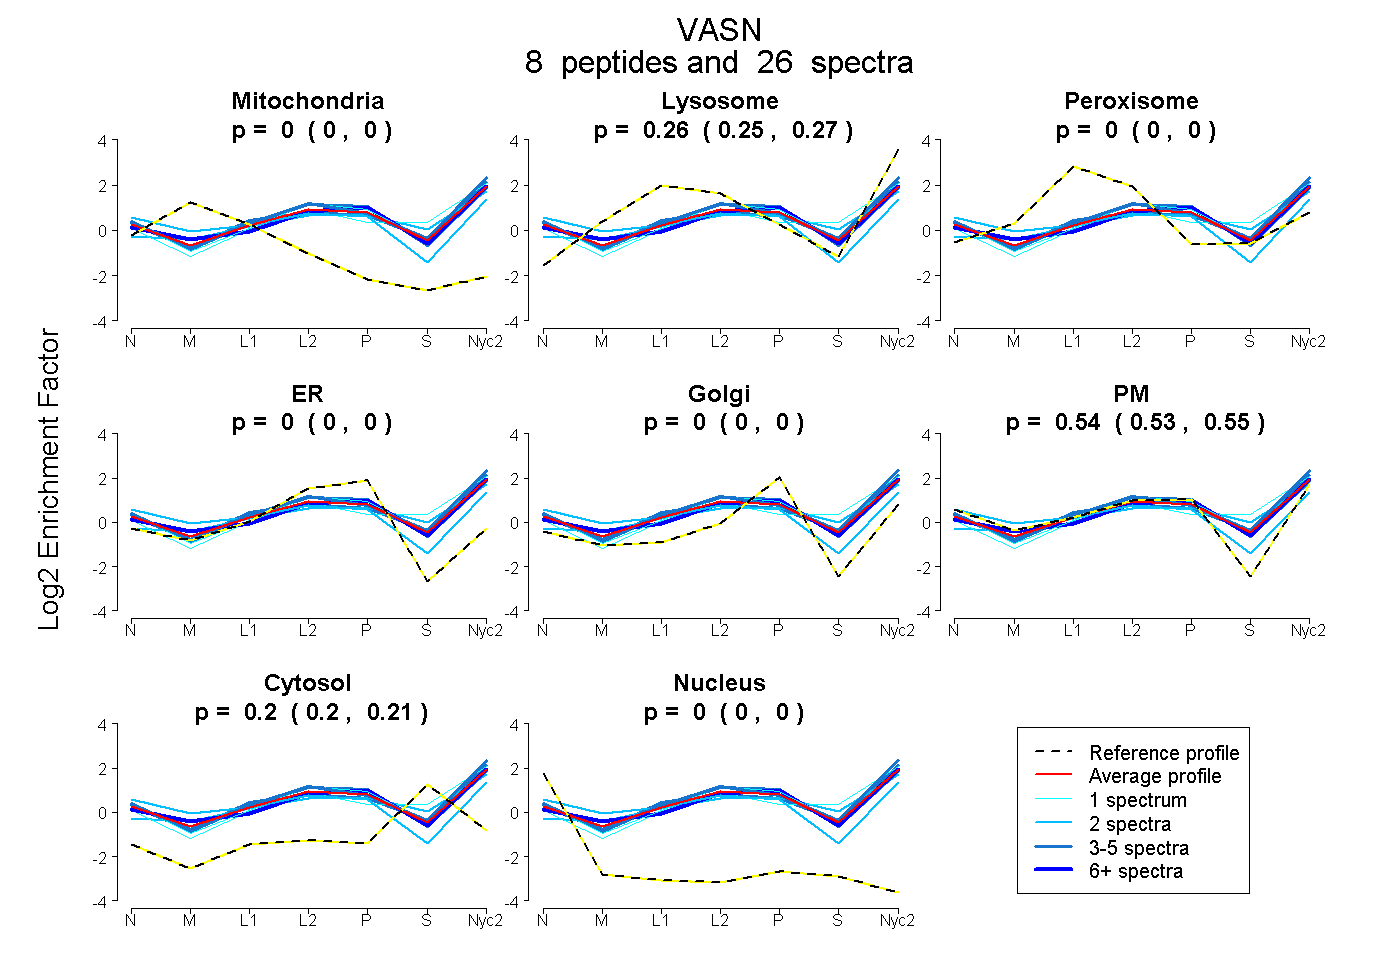
0.000 | 0.000
0.246 | 0.266
0.000 | 0.001
0.000 | 0.000
0.000 | 0.000
0.525 | 0.550
0.197 | 0.210
0.000 | 0.000
2peptides
spectra
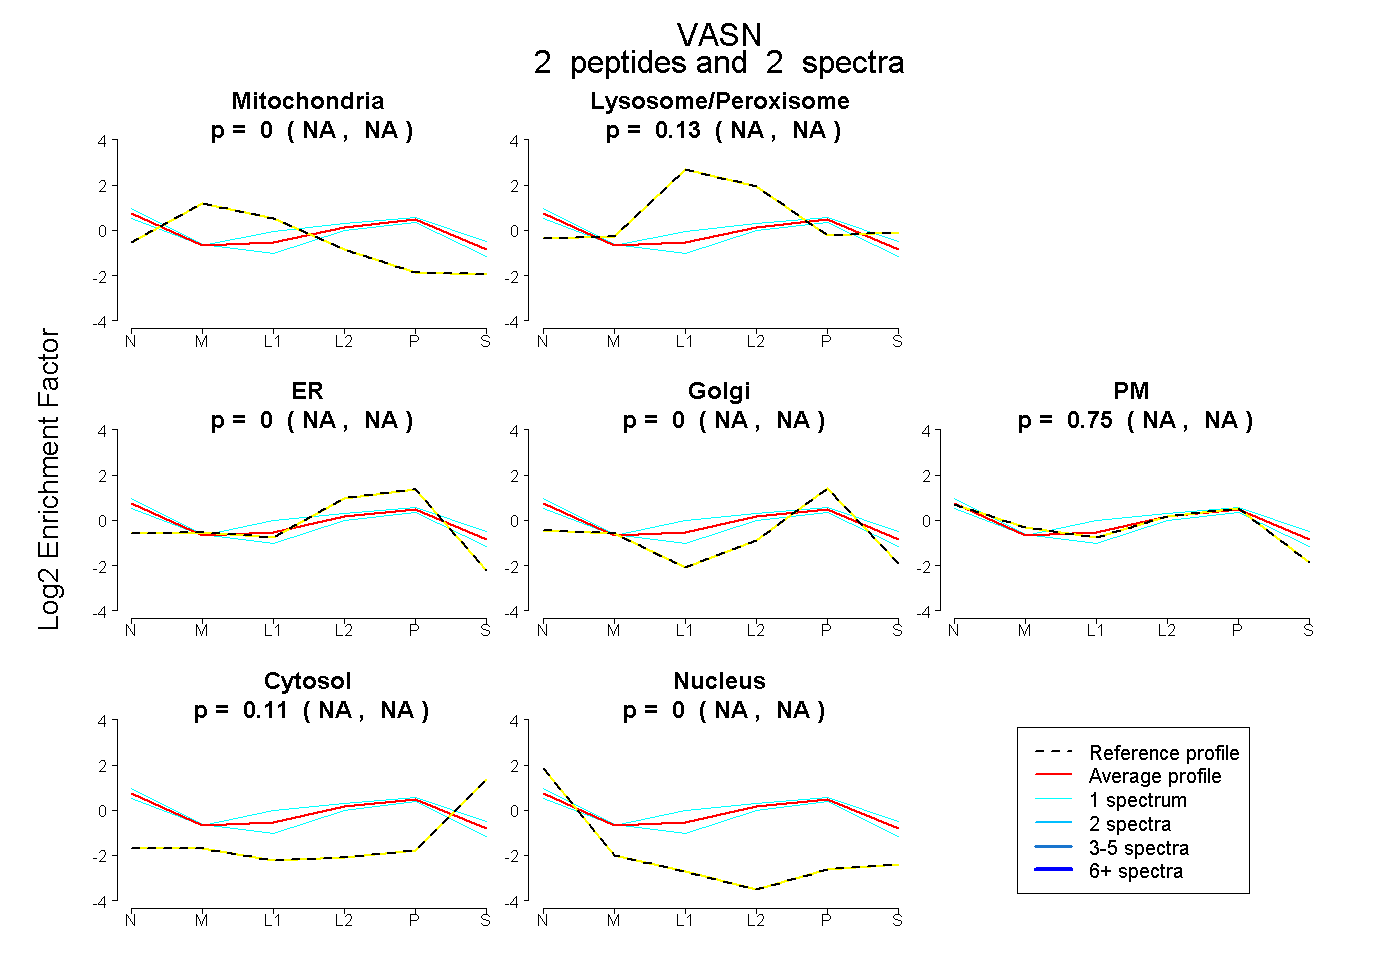
NA | NA
NA | NA
NA | NA
NA | NA
NA | NA
NA | NA
NA | NA
7peptides
spectra
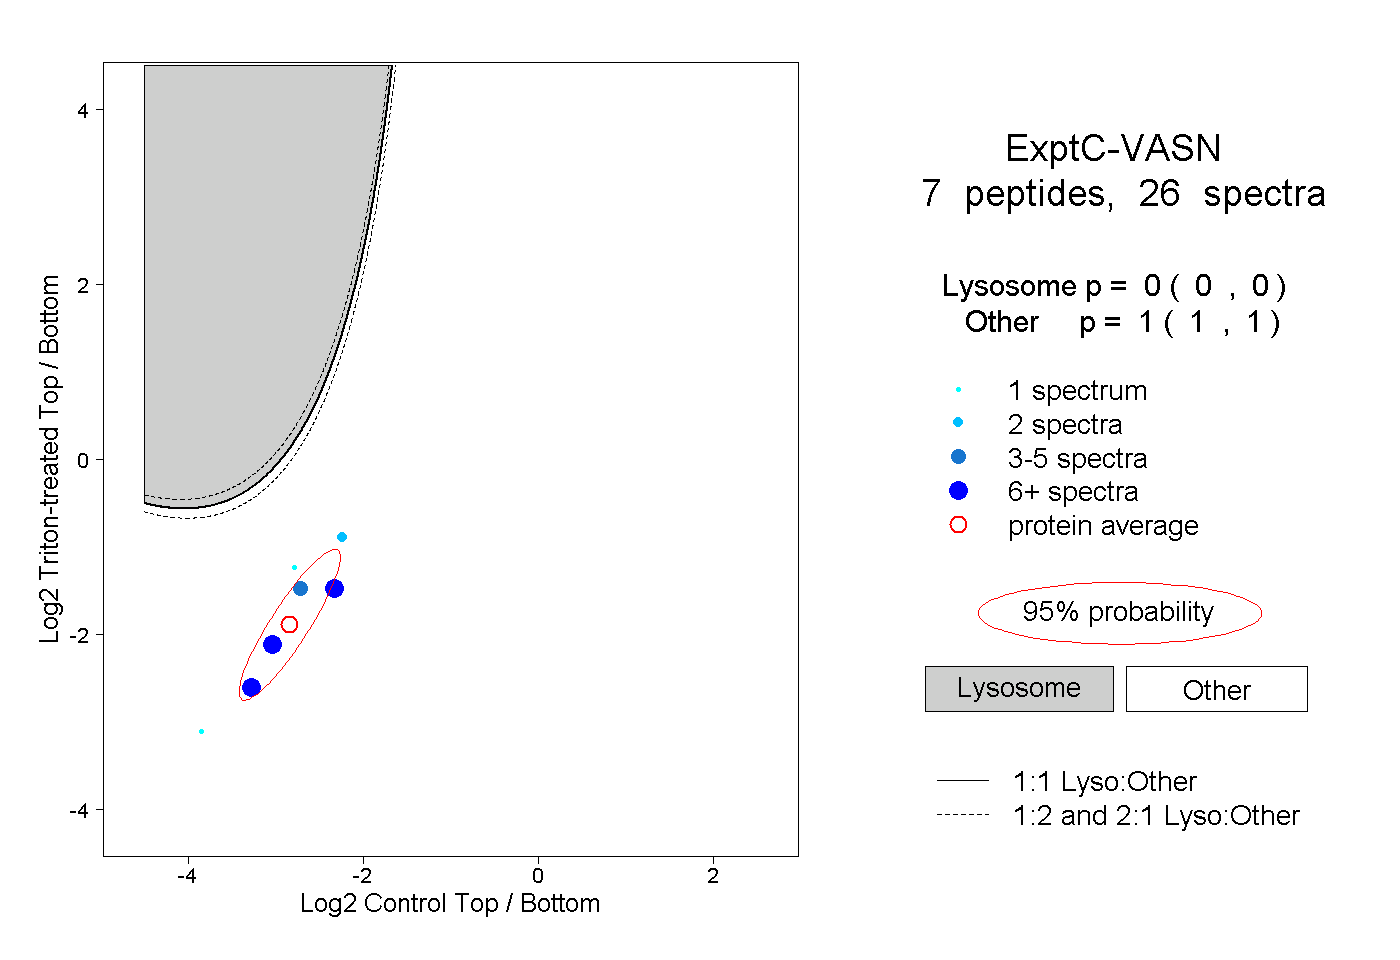
0.000 | 0.000
1.000 | 1.000
2peptides
spectra
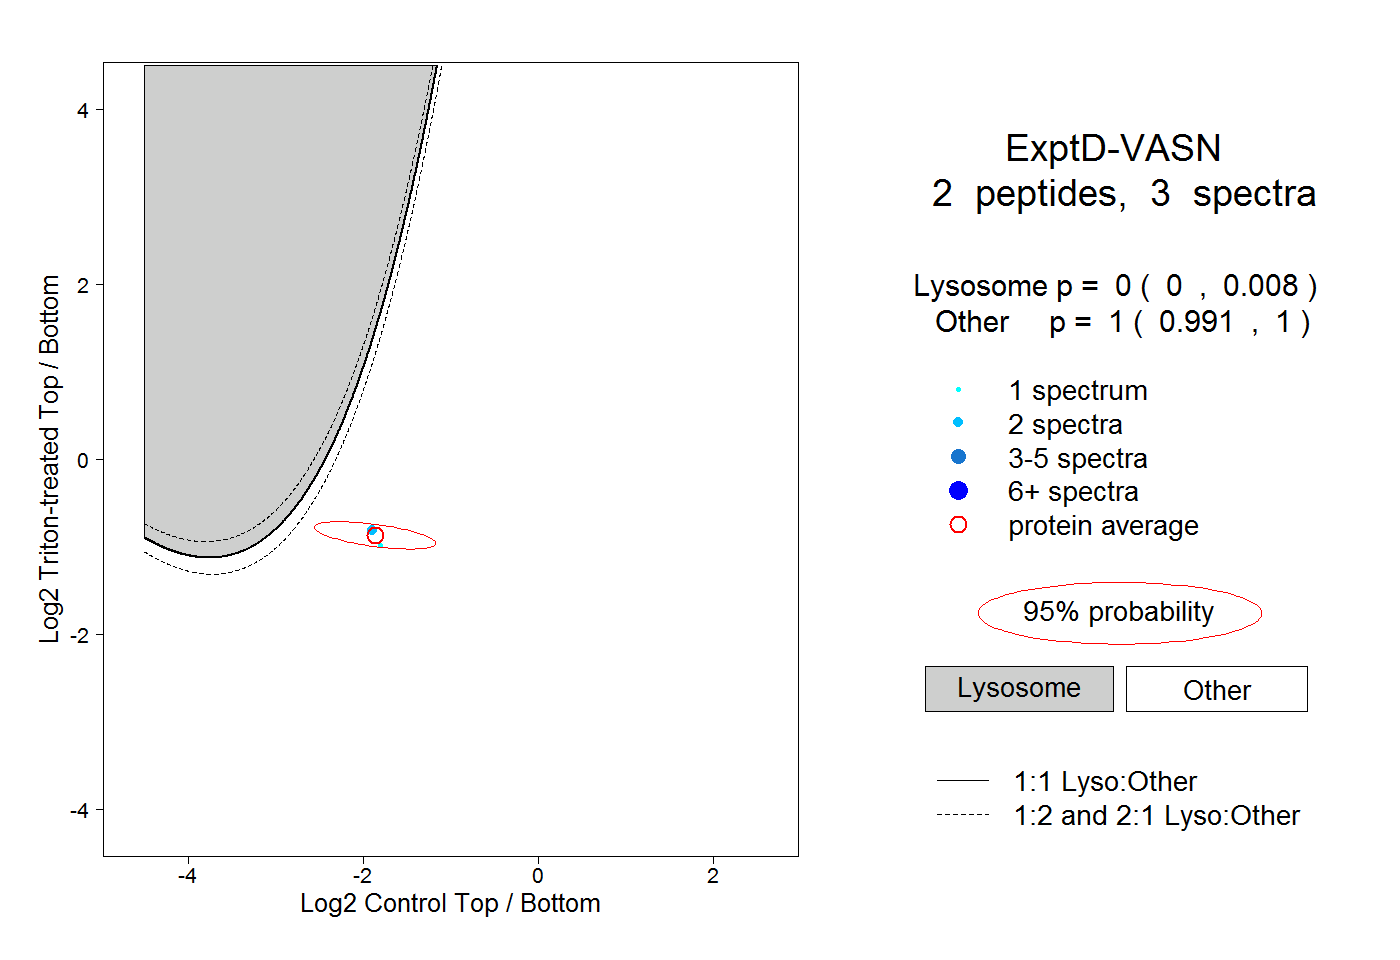
0.000 | 0.008
0.991 | 1.000