PNN
[ENSRNOP00000005439]
Main page
| | | Plot |
Mito |
Lyso |
|
Perox |
ER |
Golgi |
PM |
Cytosol |
Nucleus |
|
| Expt A |
 13
13
peptides |
45
spectra |
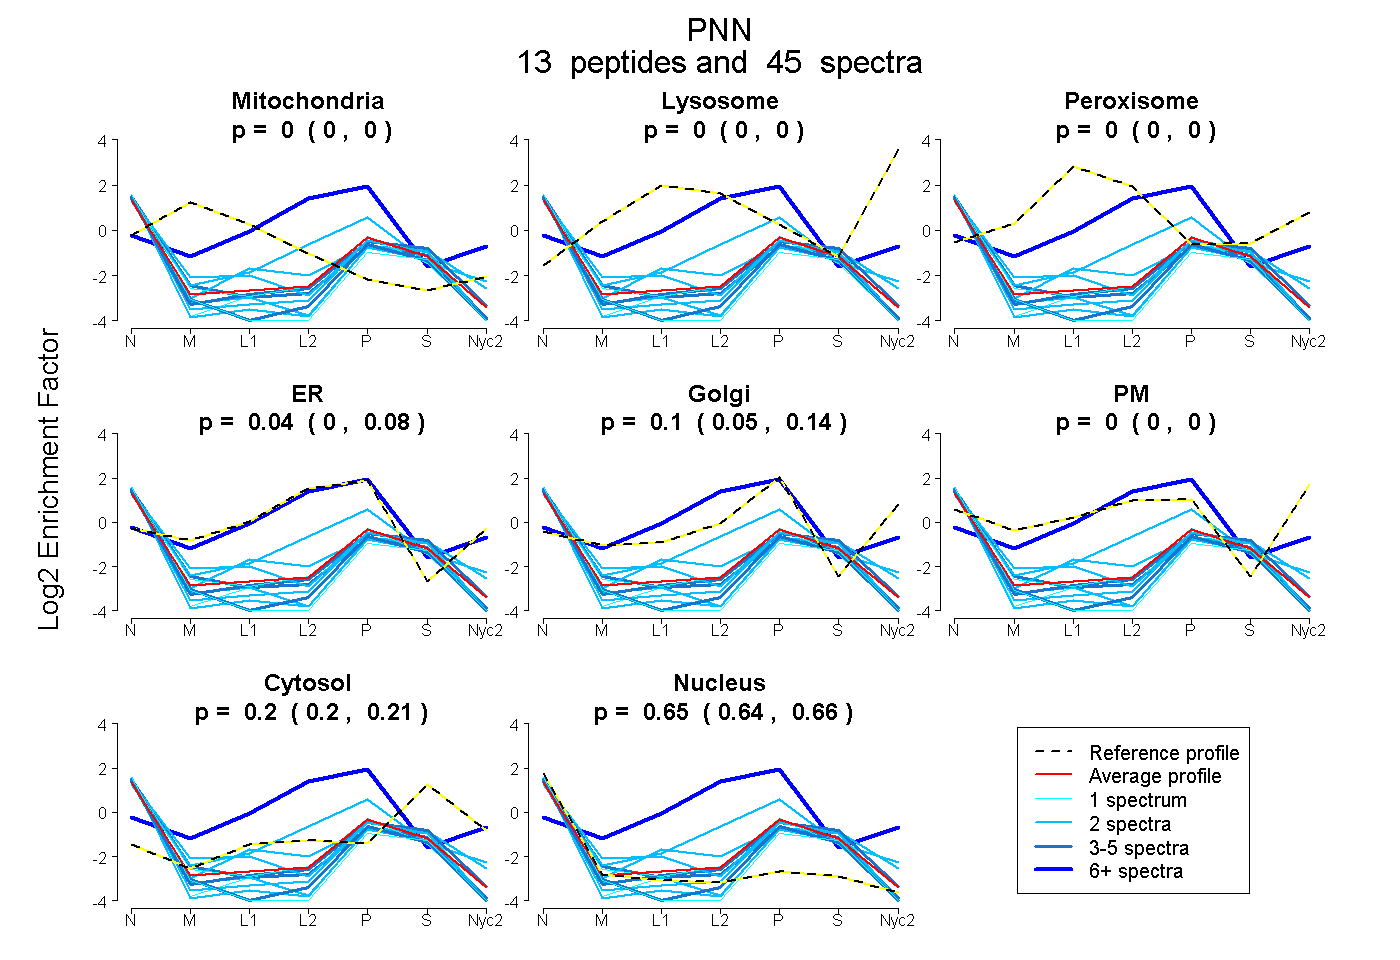 |
0.000
0.000 | 0.000 |
0.000
0.000 | 0.000 |
|
0.000
0.000 | 0.000 |
0.041
0.000 | 0.081 |
0.099
0.049 | 0.137 |
0.000
0.000 | 0.000 |
0.205
0.196 | 0.211 |
0.655
0.644 | 0.664 |
|
| | | Plot |
Mito |
|
Lyso or Perox |
|
ER |
Golgi |
PM |
Cytosol |
Nucleus |
|
| Expt B |
2
peptides |
10
spectra |
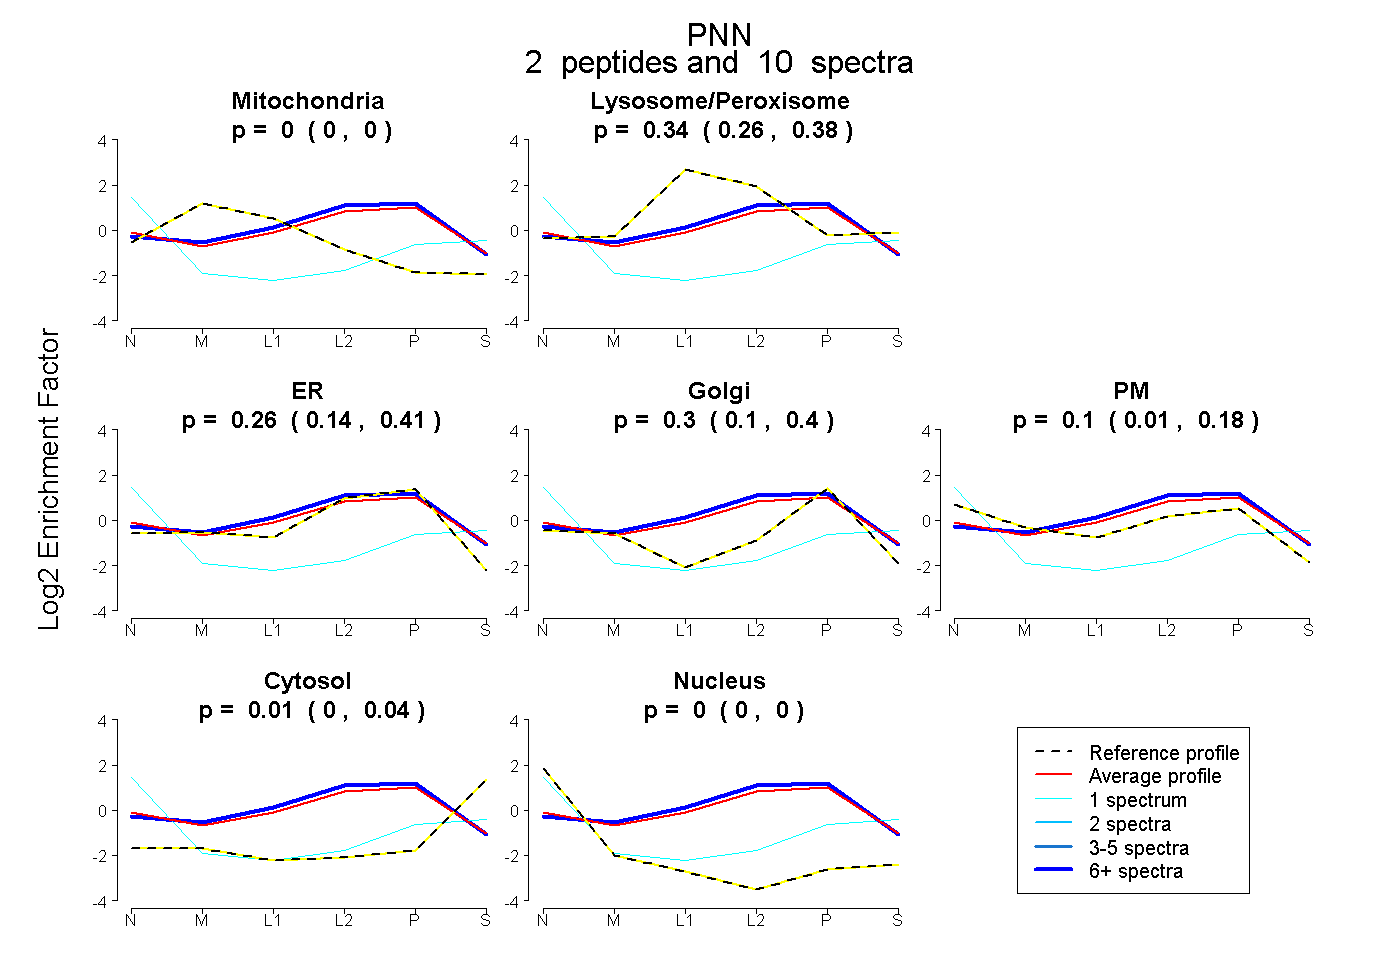 |
0.000
0.000 | 0.000 |
|
0.340
0.261 | 0.383 |
|
0.260
0.140 | 0.411 |
0.296
0.098 | 0.395 |
0.096
0.012 | 0.181 |
0.008
0.000 | 0.044 |
0.000
0.000 | 0.000 |
|
| 1 spectrum, DLEGAVSR |
0.000 |
|
0.000 |
|
0.000 |
0.000 |
0.351 |
0.262 |
0.387 |
|
| 9 spectra, AVAVR |
0.000 |
|
0.349 |
|
0.469 |
0.182 |
0.000 |
0.000 |
0.000 |
|