 3
3peptides
spectra
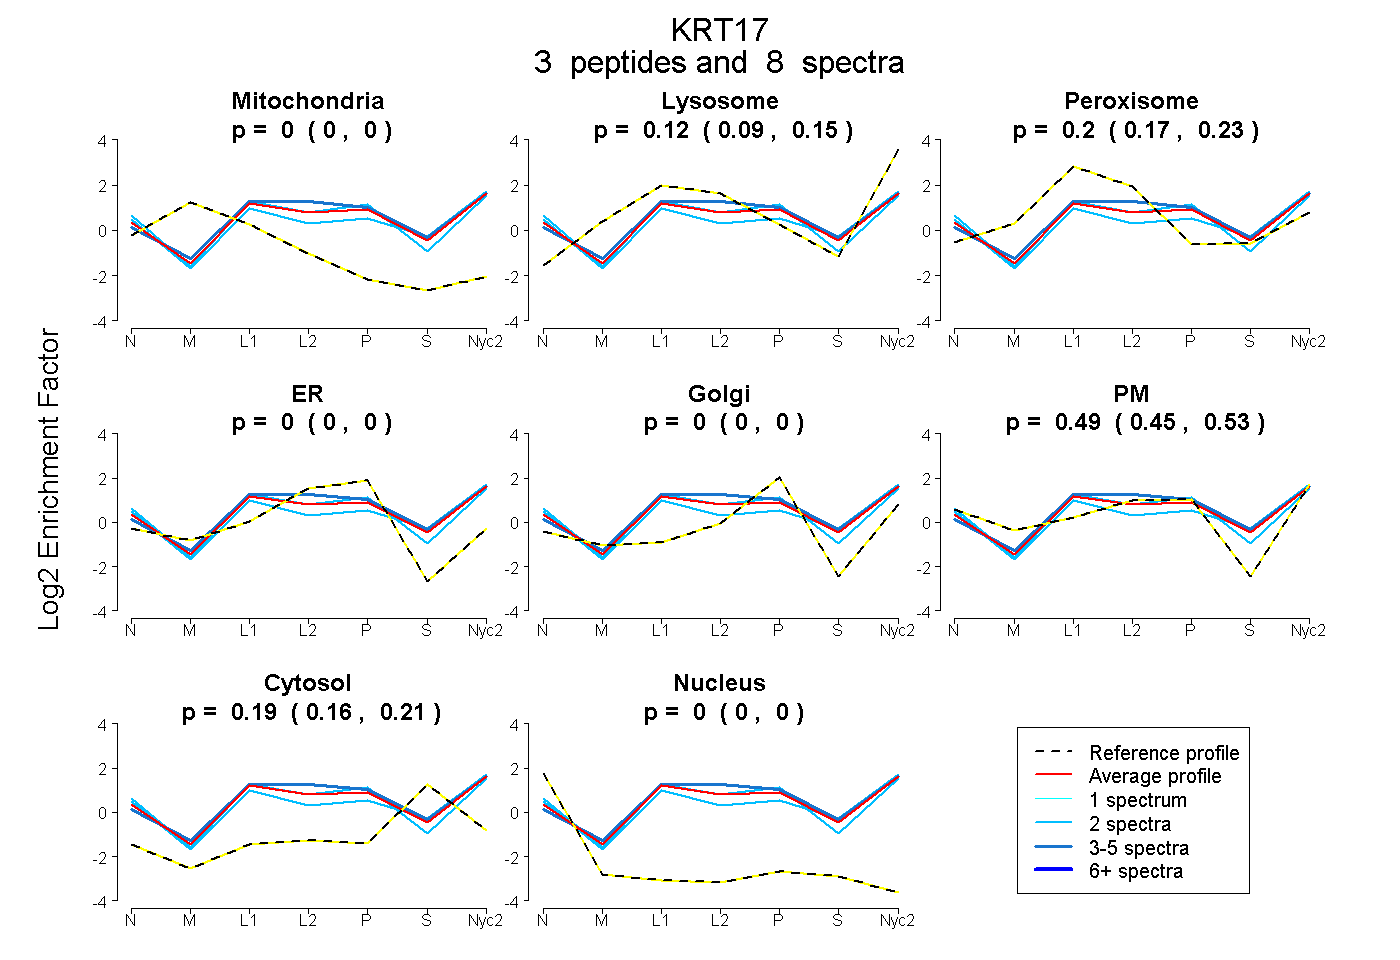
0.000 | 0.000
0.086 | 0.149
0.168 | 0.228
0.000 | 0.000
0.000 | 0.000
0.450 | 0.526
0.165 | 0.205
0.000 | 0.000
1peptide
spectra
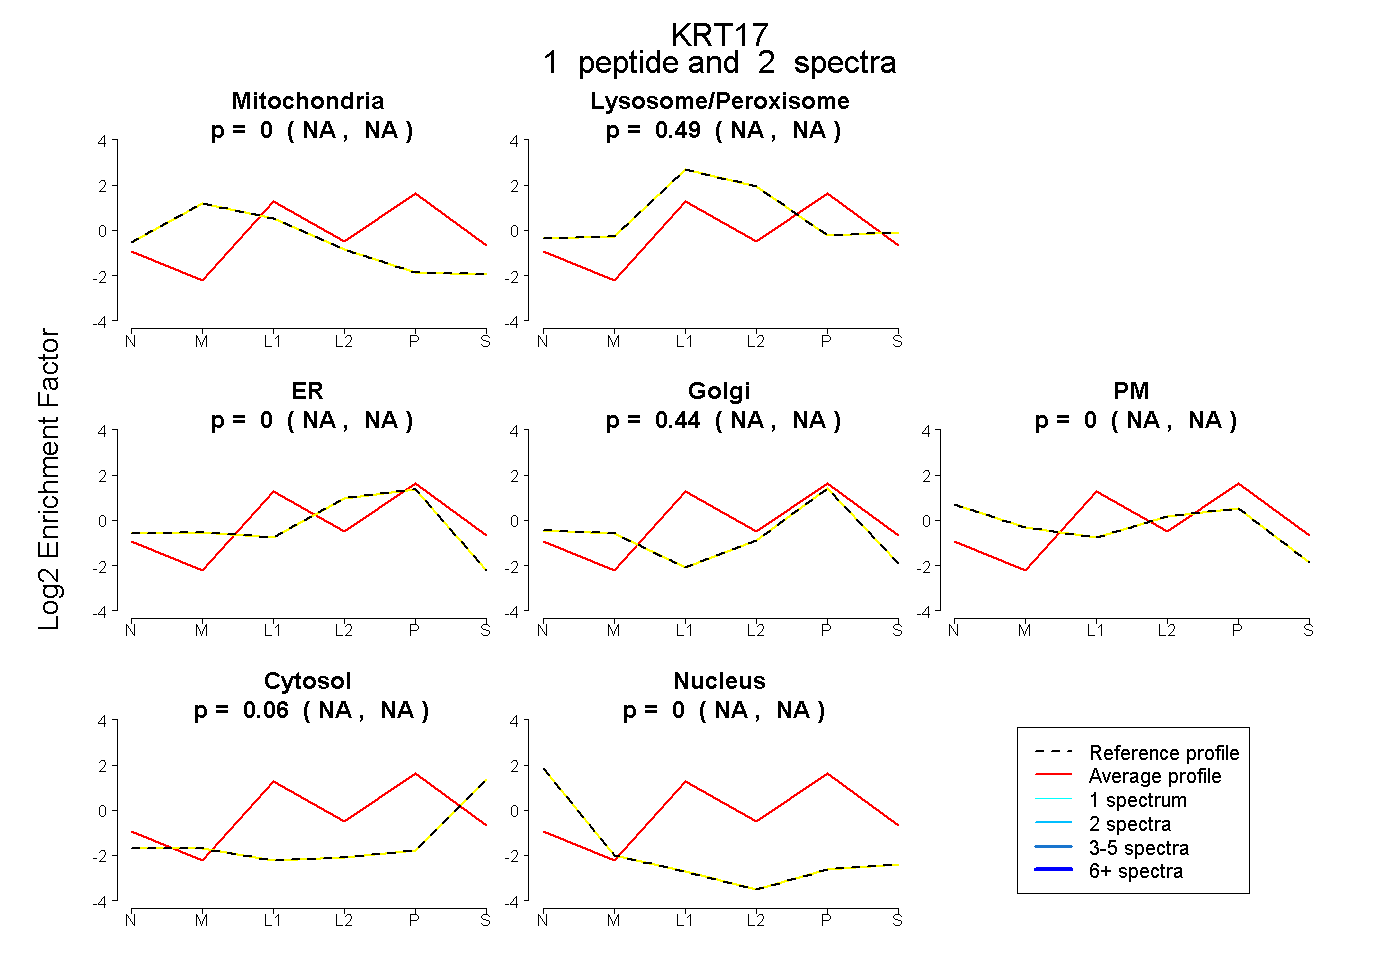
NA | NA
NA | NA
NA | NA
NA | NA
NA | NA
NA | NA
NA | NA
3peptides
spectra
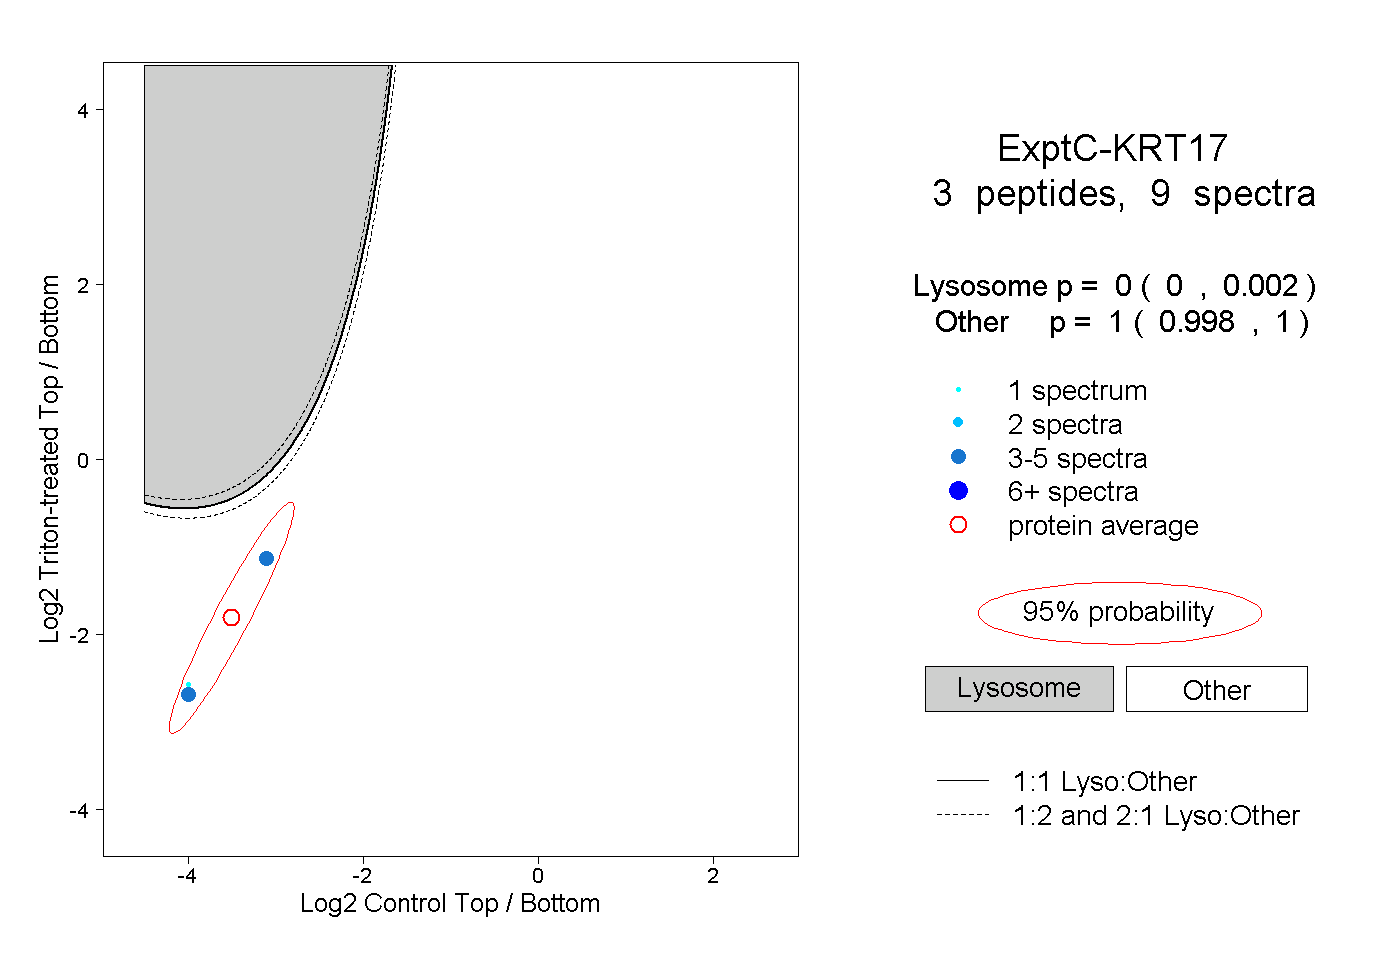
0.000 | 0.002
0.998 | 1.000
2peptides
spectra
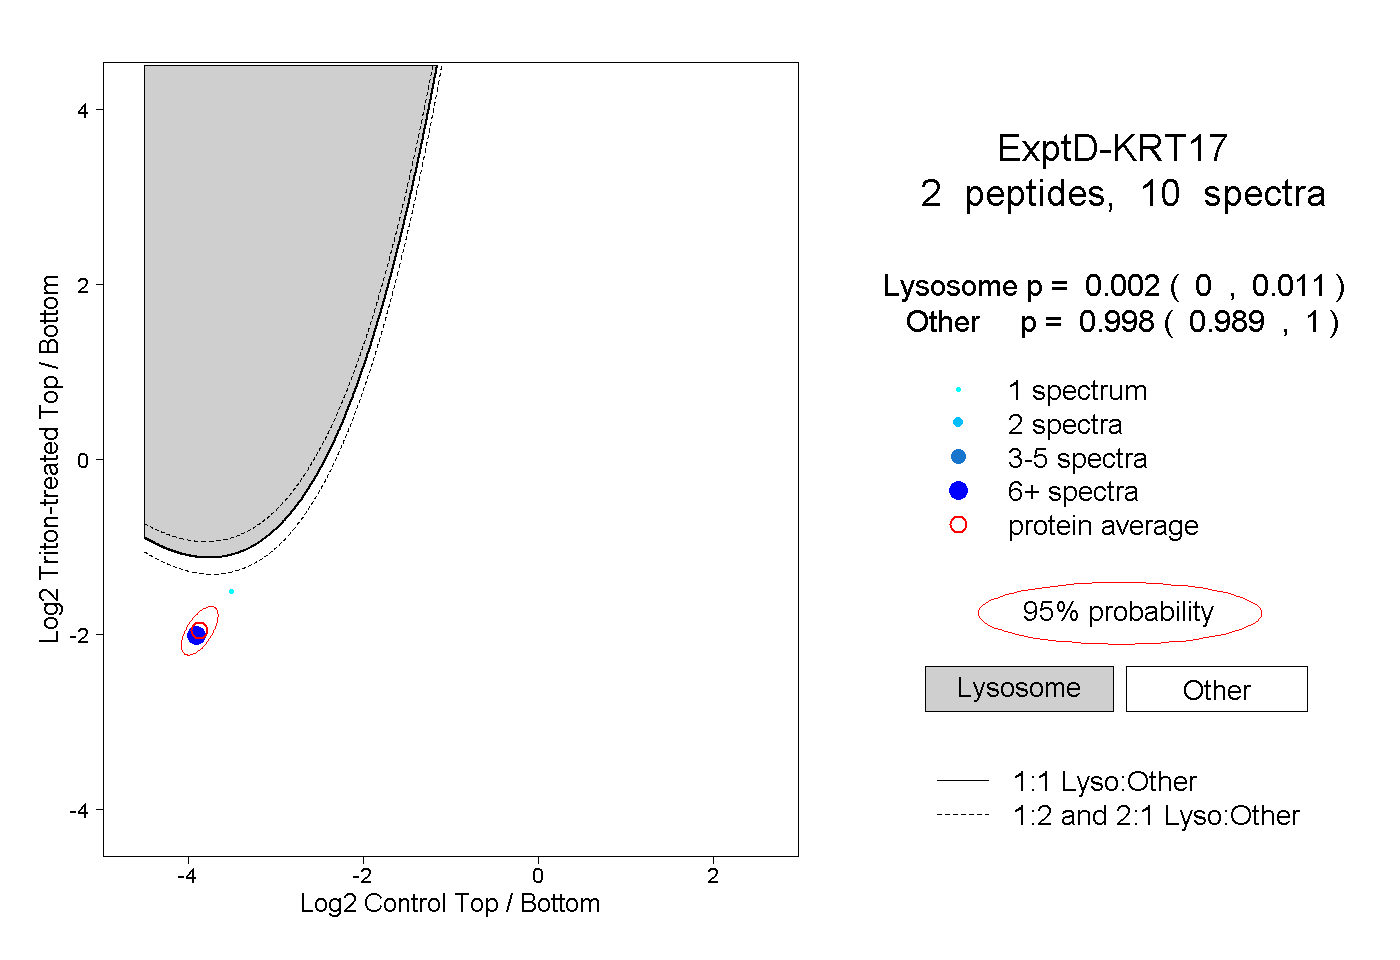
0.000 | 0.011
0.989 | 1.000