 6
6peptides
spectra
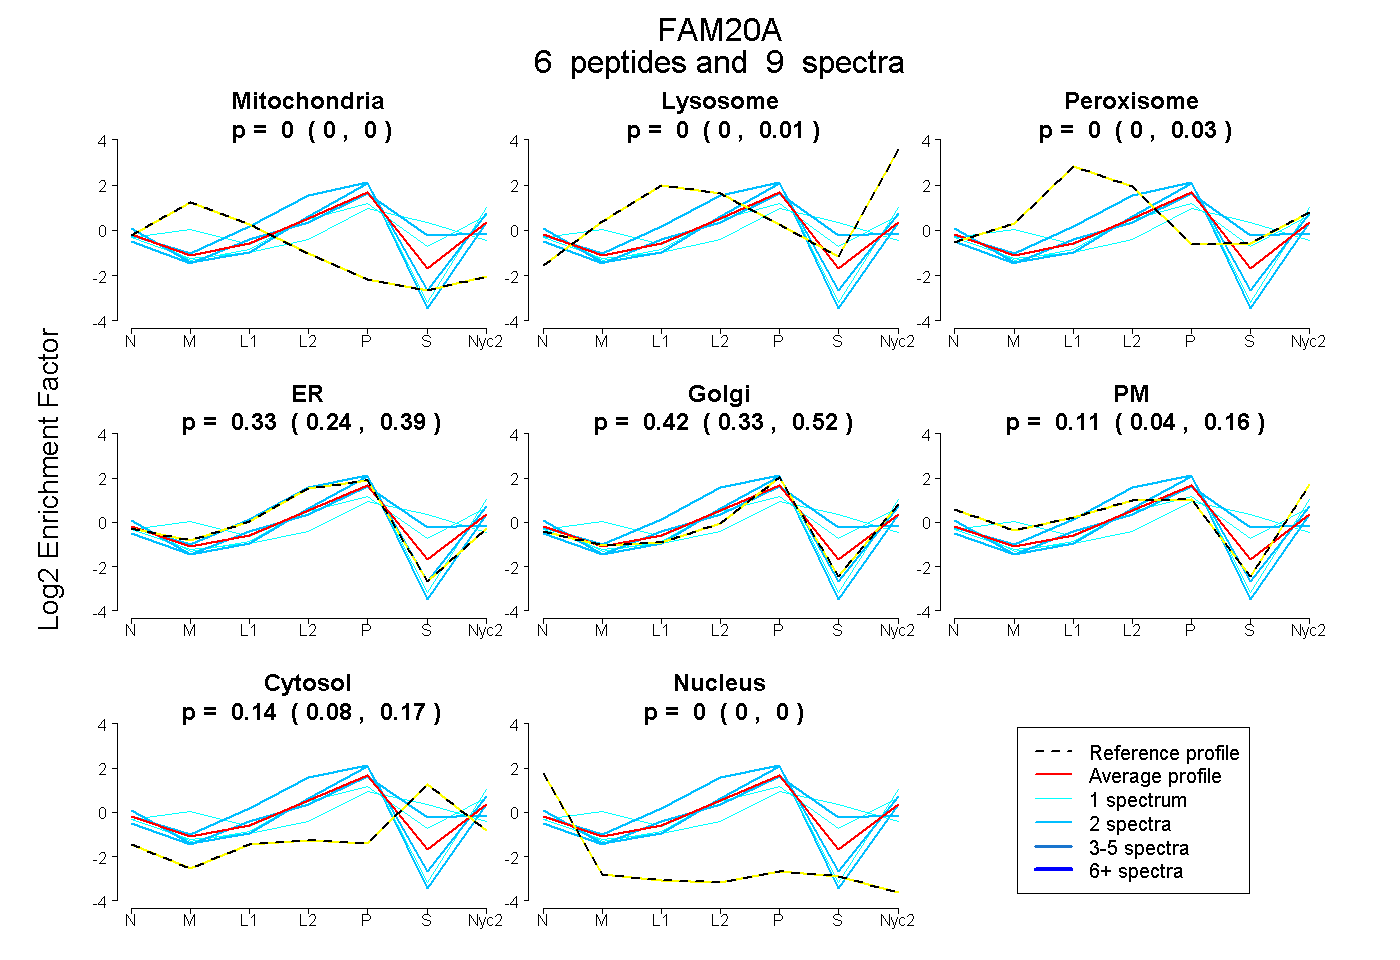
0.000 | 0.000
0.000 | 0.015
0.000 | 0.031
0.237 | 0.394
0.331 | 0.516
0.036 | 0.156
0.081 | 0.175
0.000 | 0.000
| Plot | Mito | Lyso | Perox | ER | Golgi | PM | Cytosol | Nucleus | |||||
| Expt A |
6 peptides |
9 spectra |
|
0.000 0.000 | 0.000 |
0.000 0.000 | 0.015 |
0.000 0.000 | 0.031 |
0.331 0.237 | 0.394 |
0.422 0.331 | 0.516 |
0.112 0.036 | 0.156 |
0.136 0.081 | 0.175 |
0.000 0.000 | 0.000 |
| 1 spectrum, LLHDMR | 0.000 | 0.000 | 0.029 | 0.167 | 0.302 | 0.000 | 0.502 | 0.000 | ||
| 2 spectra, TVEDCIEAHGER | 0.000 | 0.000 | 0.049 | 0.372 | 0.245 | 0.000 | 0.335 | 0.000 | ||
| 2 spectra, ILDFR | 0.000 | 0.000 | 0.000 | 0.846 | 0.015 | 0.139 | 0.000 | 0.000 | ||
| 2 spectra, QLGPGERPAGCPCSGR | 0.000 | 0.000 | 0.000 | 0.212 | 0.720 | 0.057 | 0.000 | 0.011 | ||
| 1 spectrum, HNAEIAAFHLDR | 0.000 | 0.035 | 0.180 | 0.000 | 0.507 | 0.114 | 0.163 | 0.000 | ||
| 1 spectrum, LSVPNPWIR | 0.000 | 0.000 | 0.000 | 0.146 | 0.697 | 0.156 | 0.000 | 0.000 |
| Plot | Lyso | Other | |||||||||||
| Expt C |
2 peptides |
2 spectra |
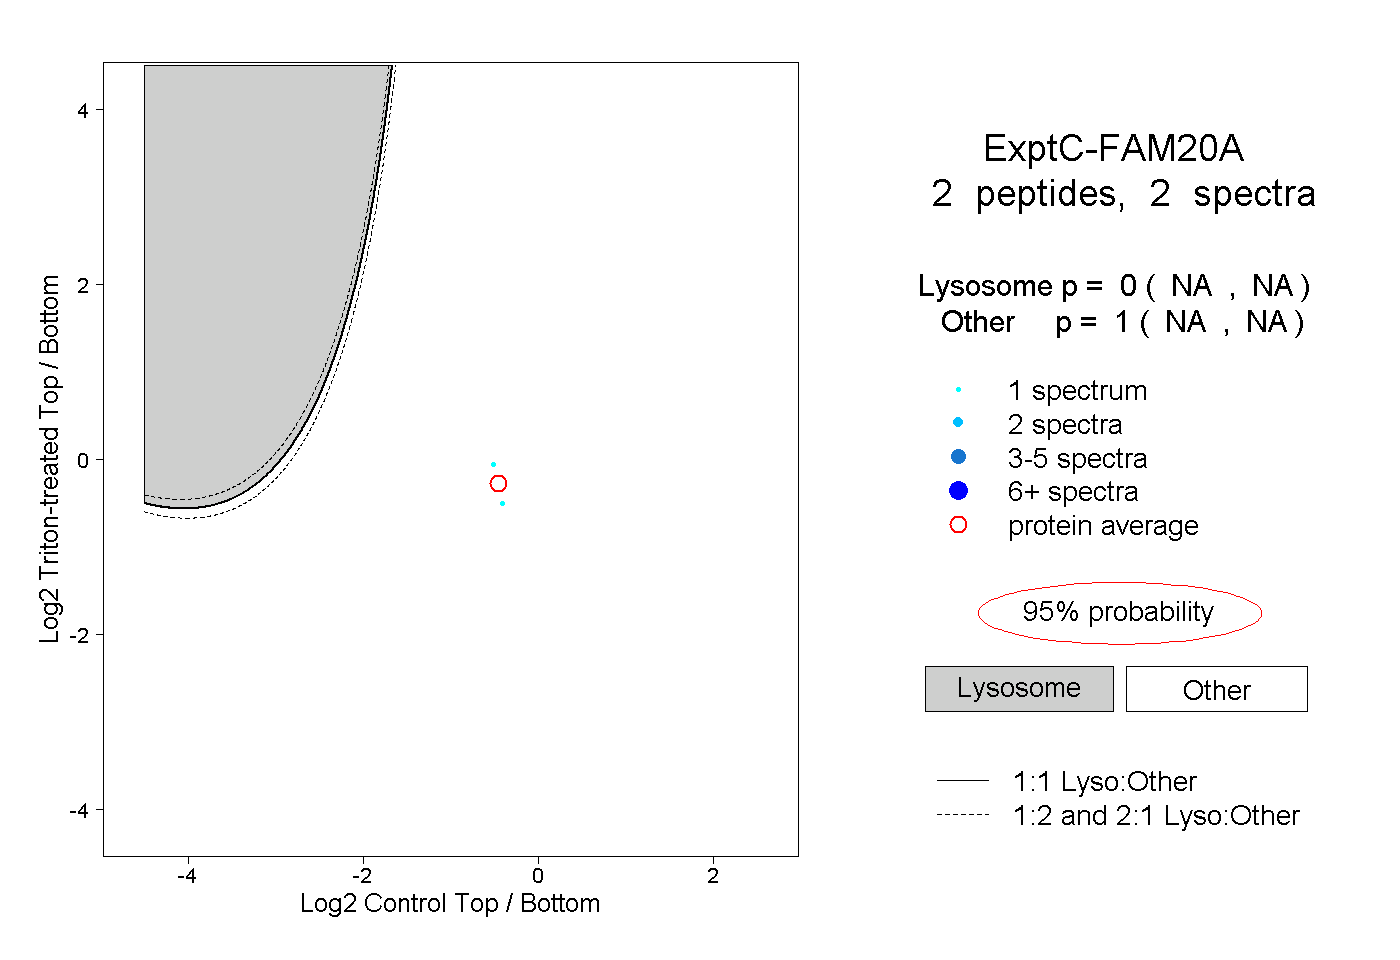 |
0.000 NA | NA |
1.000 NA | NA |