 2
2peptides
spectra

0.043 | 0.121
0.000 | 0.098
0.000 | 0.074
0.345 | 0.556
0.000 | 0.186
0.186 | 0.383
0.000 | 0.000
0.000 | 0.000
1peptide
spectrum
NA | NA
NA | NA
| Plot | Mito | Lyso | Perox | ER | Golgi | PM | Cytosol | Nucleus | |||||
| Expt A |
2 peptides |
5 spectra |
|
0.091 0.043 | 0.121 |
0.064 0.000 | 0.098 |
0.000 0.000 | 0.074 |
0.480 0.345 | 0.556 |
0.069 0.000 | 0.186 |
0.295 0.186 | 0.383 |
0.000 0.000 | 0.000 |
0.000 0.000 | 0.000 |
||
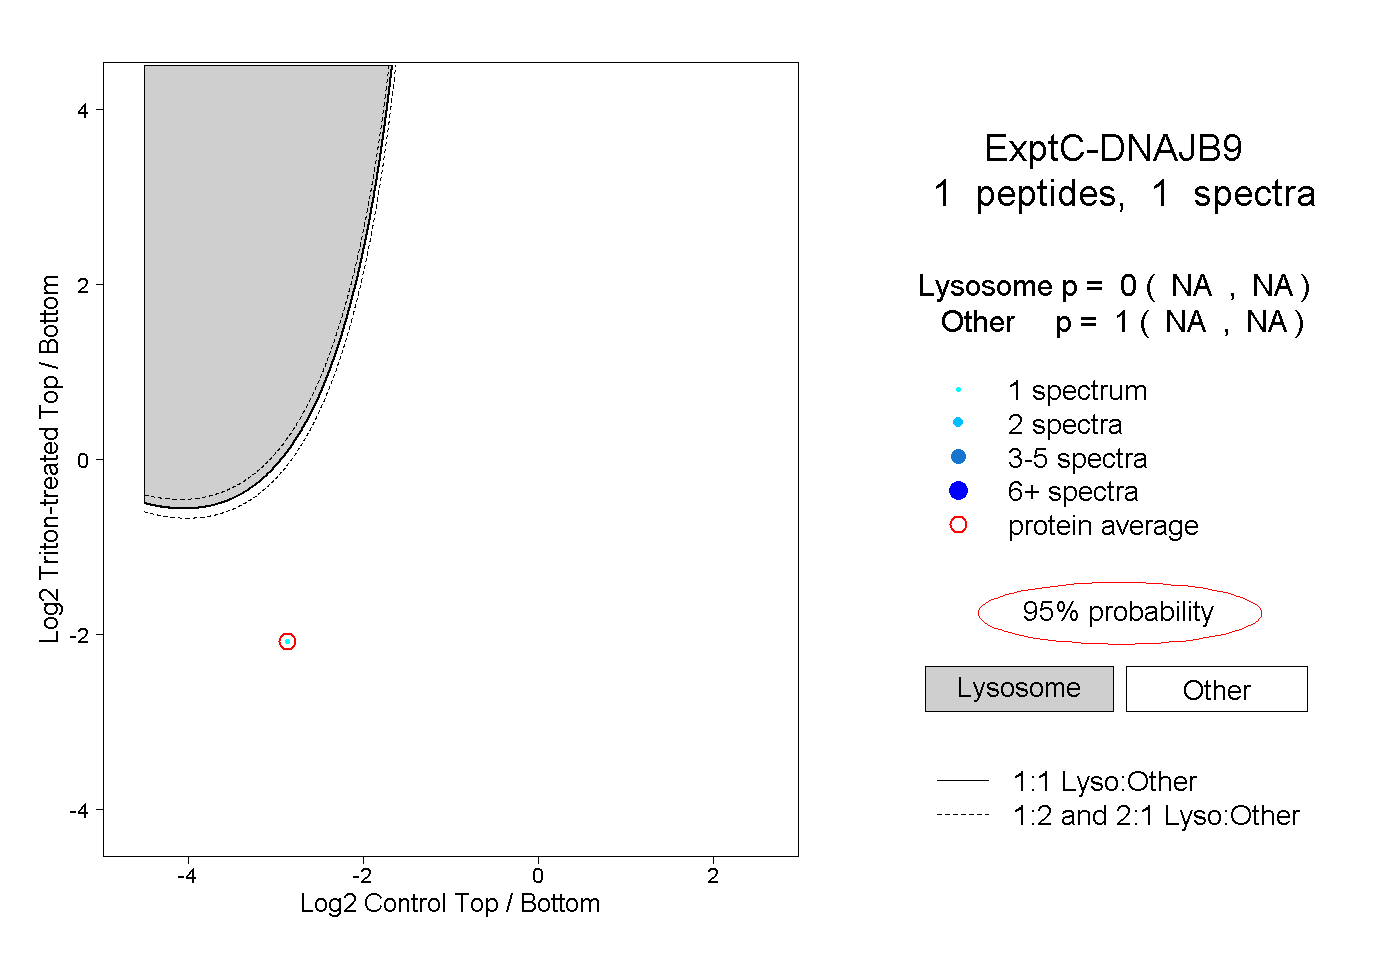
| Plot | Lyso | Other | |||||||||||
| Expt C |
1 peptide |
1 spectrum |
|
0.000 NA | NA |
1.000 NA | NA |