 11
11peptides
spectra
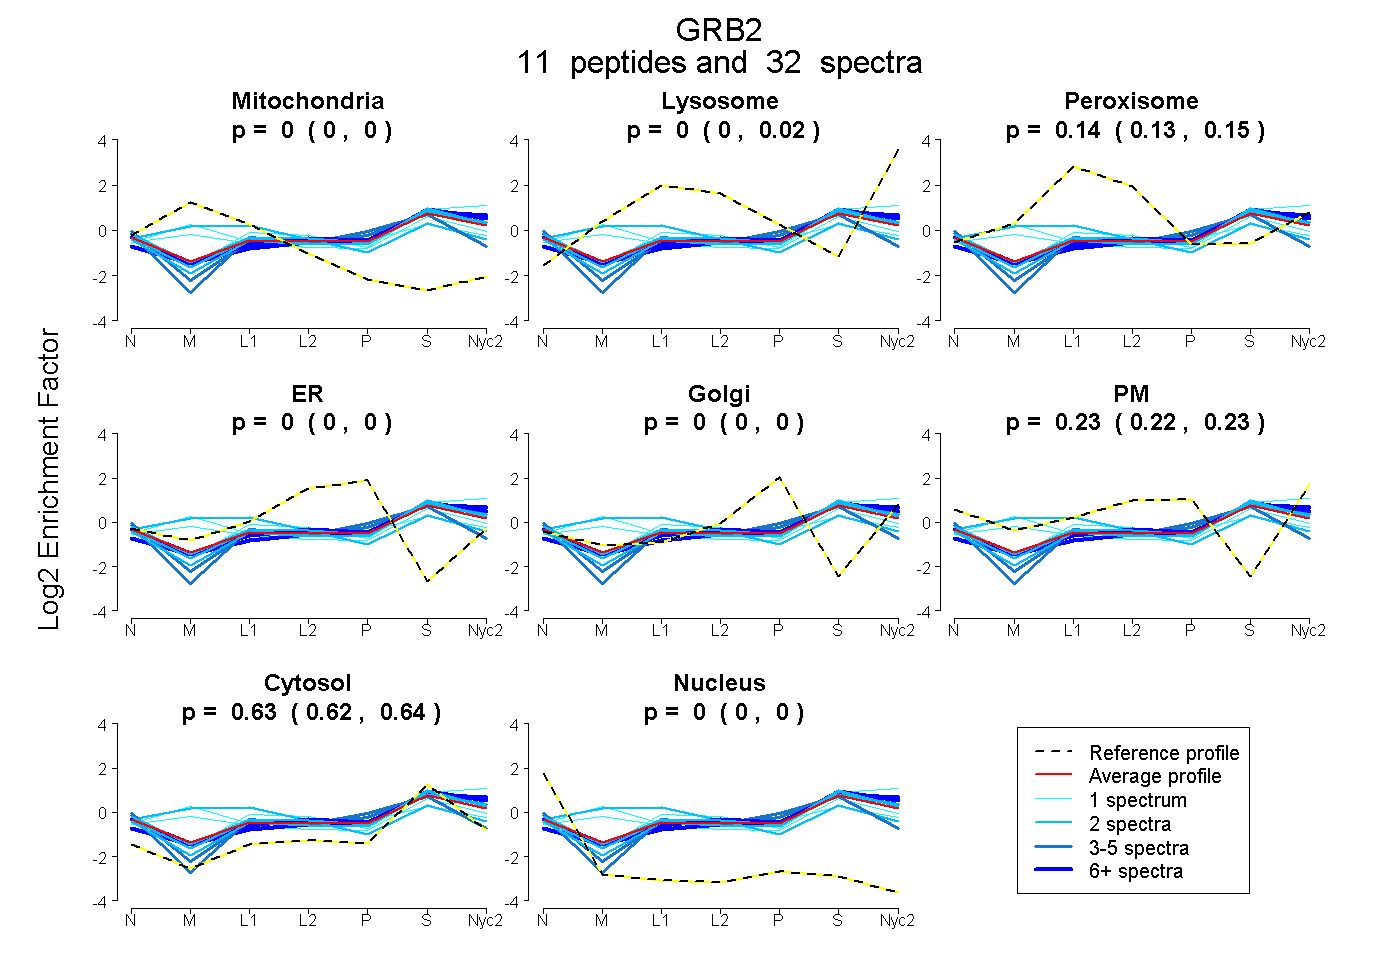
0.000 | 0.000
0.000 | 0.017
0.127 | 0.151
0.000 | 0.000
0.000 | 0.000
0.216 | 0.231
0.622 | 0.635
0.000 | 0.000
4peptides
spectra
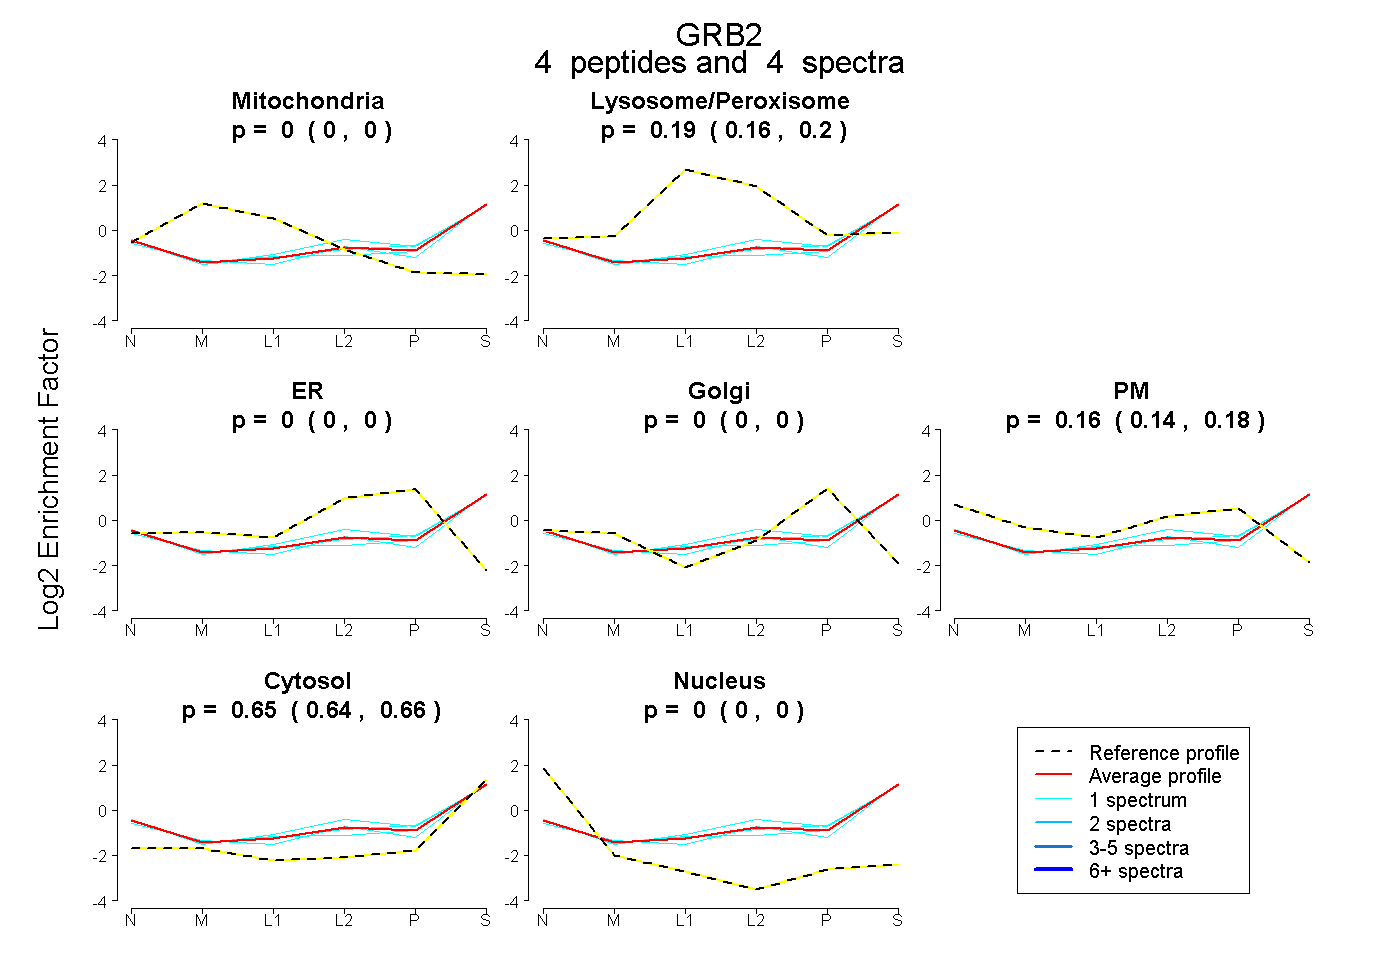
0.000 | 0.000
0.164 | 0.205
0.000 | 0.000
0.000 | 0.000
0.142 | 0.177
0.637 | 0.664
0.000 | 0.000
11peptides
spectra
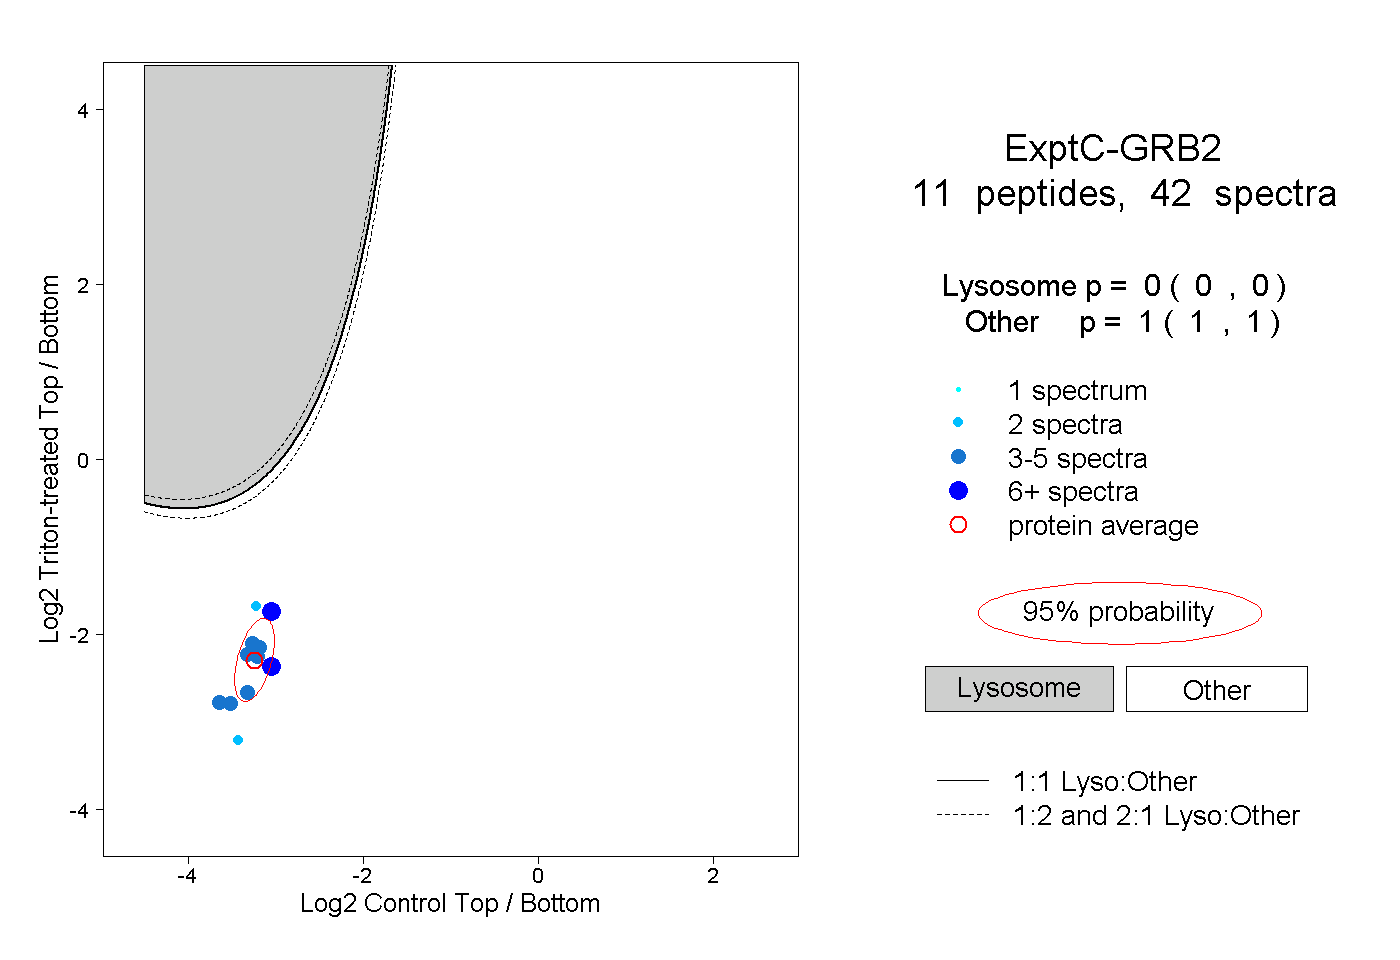
0.000 | 0.000
1.000 | 1.000
1peptide
spectrum

NA | NA
NA | NA