RPTOR
[ENSRNOP00000005337]
Main page
| | | Plot |
Mito |
Lyso |
|
Perox |
ER |
Golgi |
PM |
Cytosol |
Nucleus |
|
| Expt A |
 11
11
peptides |
18
spectra |
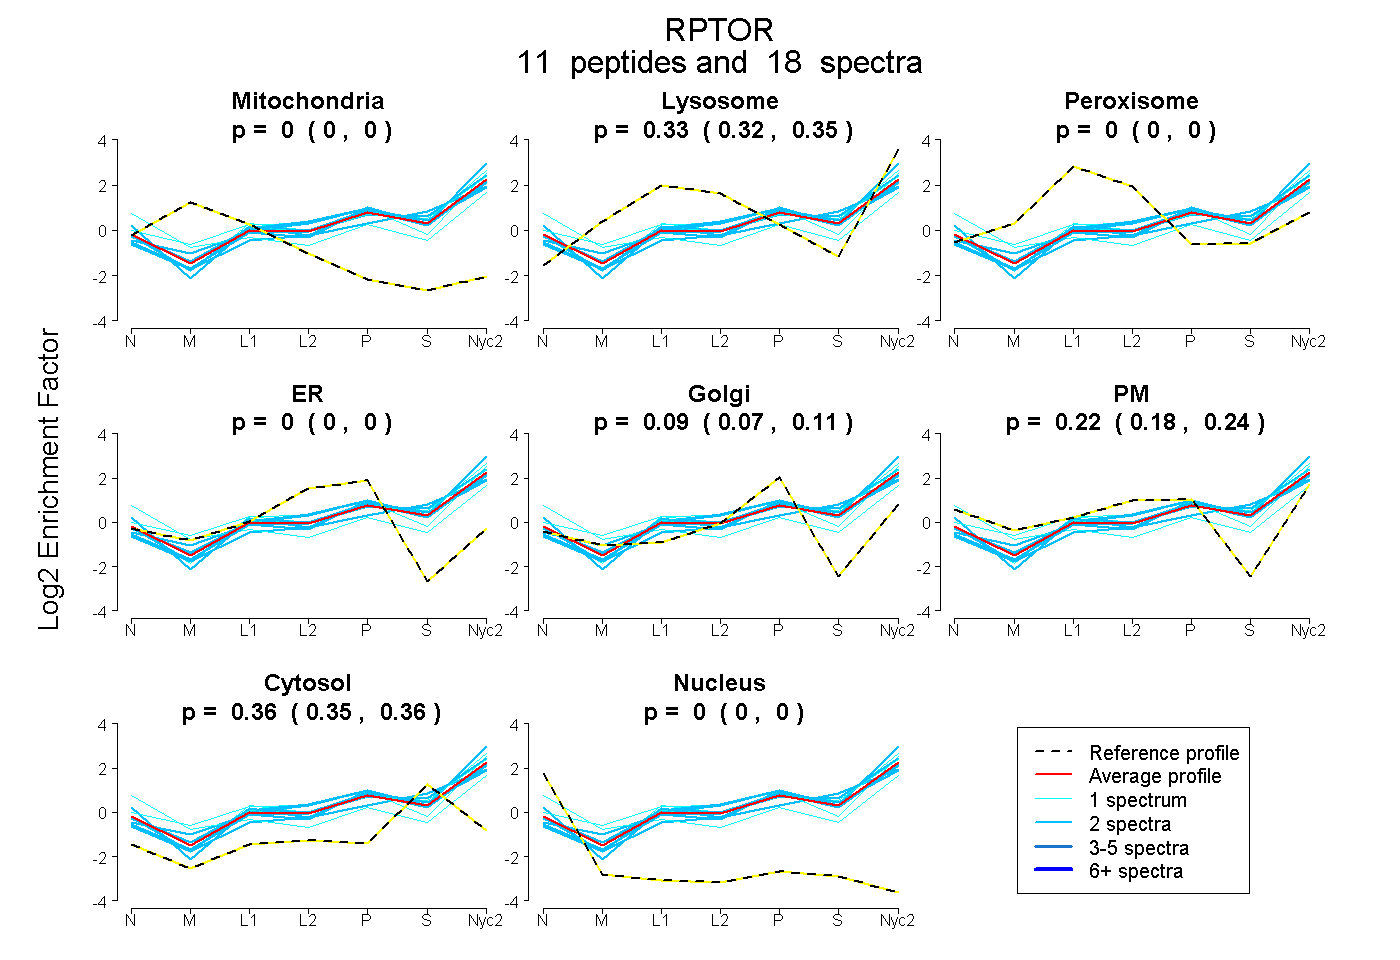 |
0.000
0.000 | 0.000 |
0.334
0.319 | 0.346 |
|
0.000
0.000 | 0.000 |
0.000
0.000 | 0.000 |
0.093
0.068 | 0.115 |
0.216
0.181 | 0.243 |
0.357
0.349 | 0.364 |
0.000
0.000 | 0.000 |
|
| | | Plot |
Mito |
|
Lyso or Perox |
|
ER |
Golgi |
PM |
Cytosol |
Nucleus |
|
| Expt B |
3
peptides |
5
spectra |
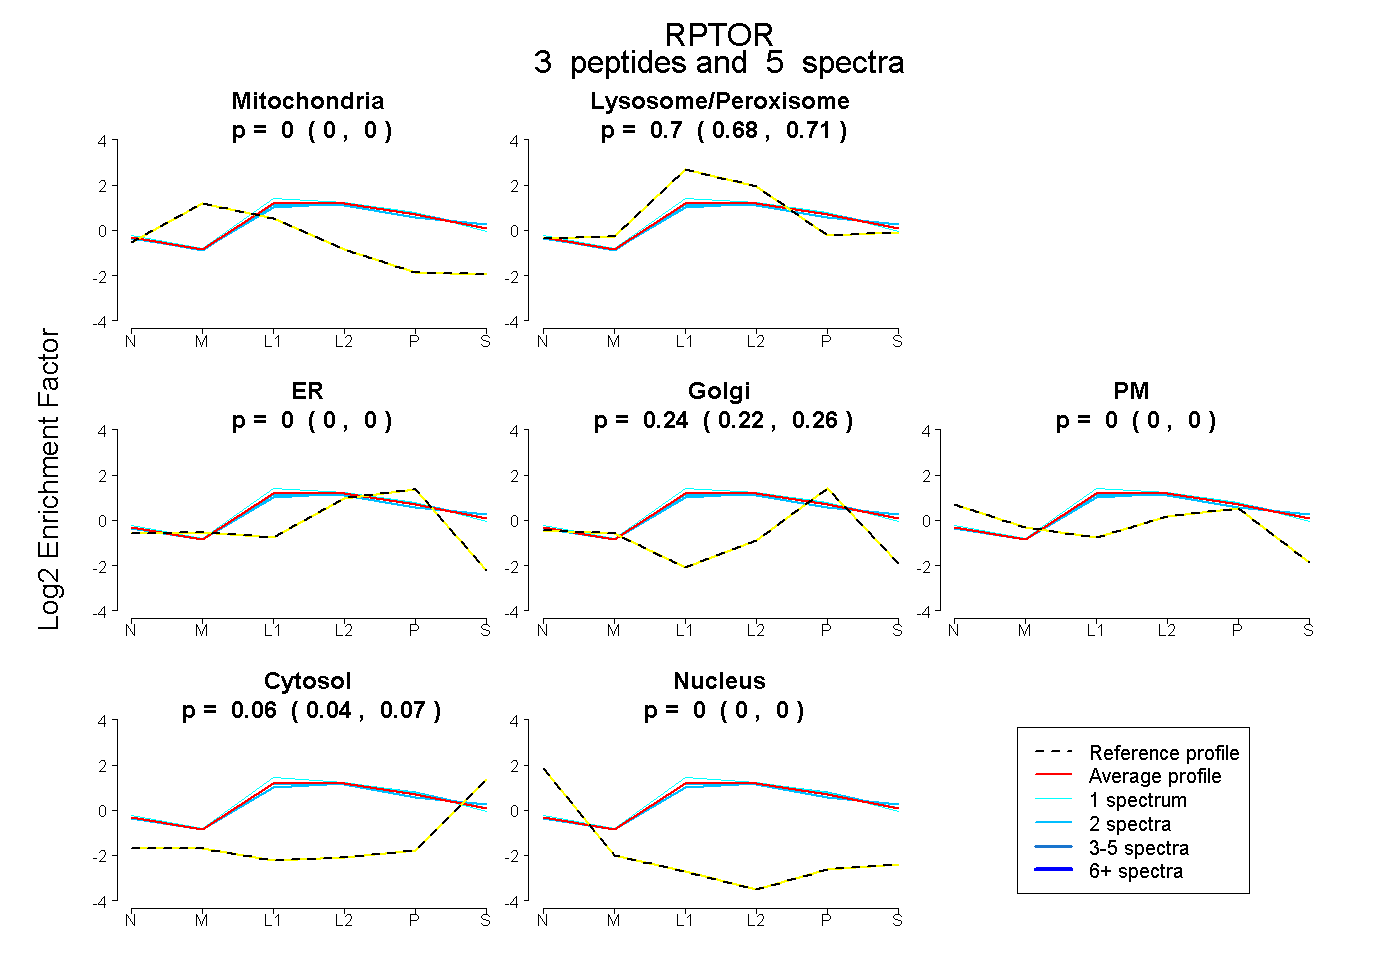 |
0.000
0.000 | 0.000 |
|
0.699
0.683 | 0.711 |
|
0.000
0.000 | 0.000 |
0.243
0.224 | 0.258 |
0.000
0.000 | 0.000 |
0.058
0.044 | 0.069 |
0.000
0.000 | 0.000 |
|
| 2 spectra, IPEEHDLESQIR |
0.000 |
|
0.662 |
|
0.031 |
0.242 |
0.000 |
0.066 |
0.000 |
|
| 1 spectrum, LDDQIFLNR |
0.000 |
|
0.735 |
|
0.000 |
0.260 |
0.000 |
0.005 |
0.000 |
|
| 2 spectra, LLQSSAR |
0.000 |
|
0.697 |
|
0.000 |
0.203 |
0.000 |
0.100 |
0.000 |
|
| | | Plot |
|
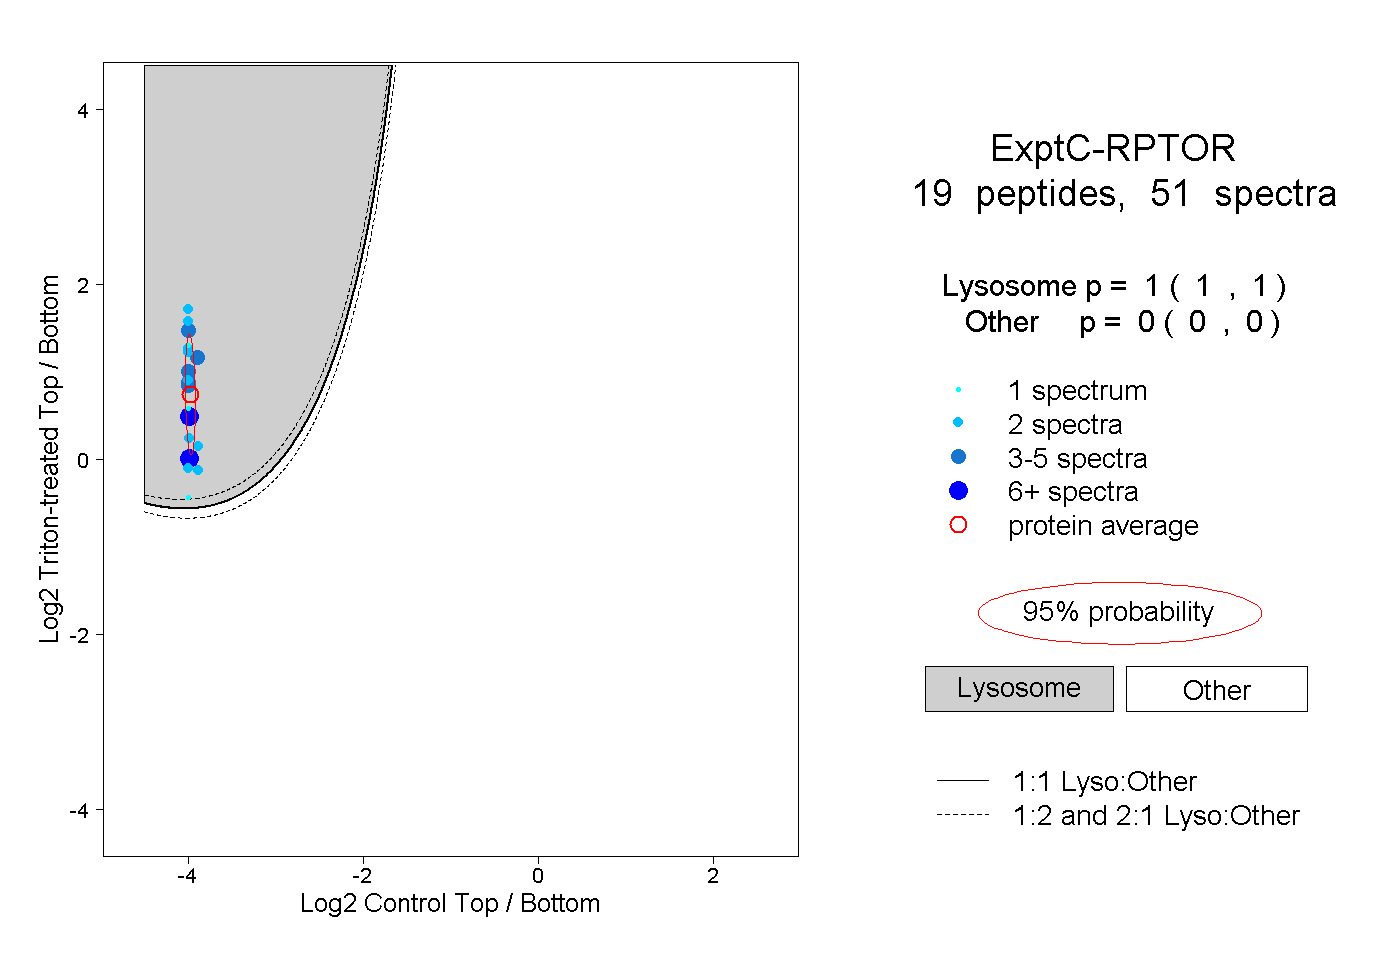
Lyso |
|
|
|
|
|
|
|
Other |
| Expt C |
19
peptides |
51
spectra |
 |
|
1.000
1.000 | 1.000 |
|
|
|
|
|
|
|
0.000
0.000 | 0.000 |
| | | Plot |
|
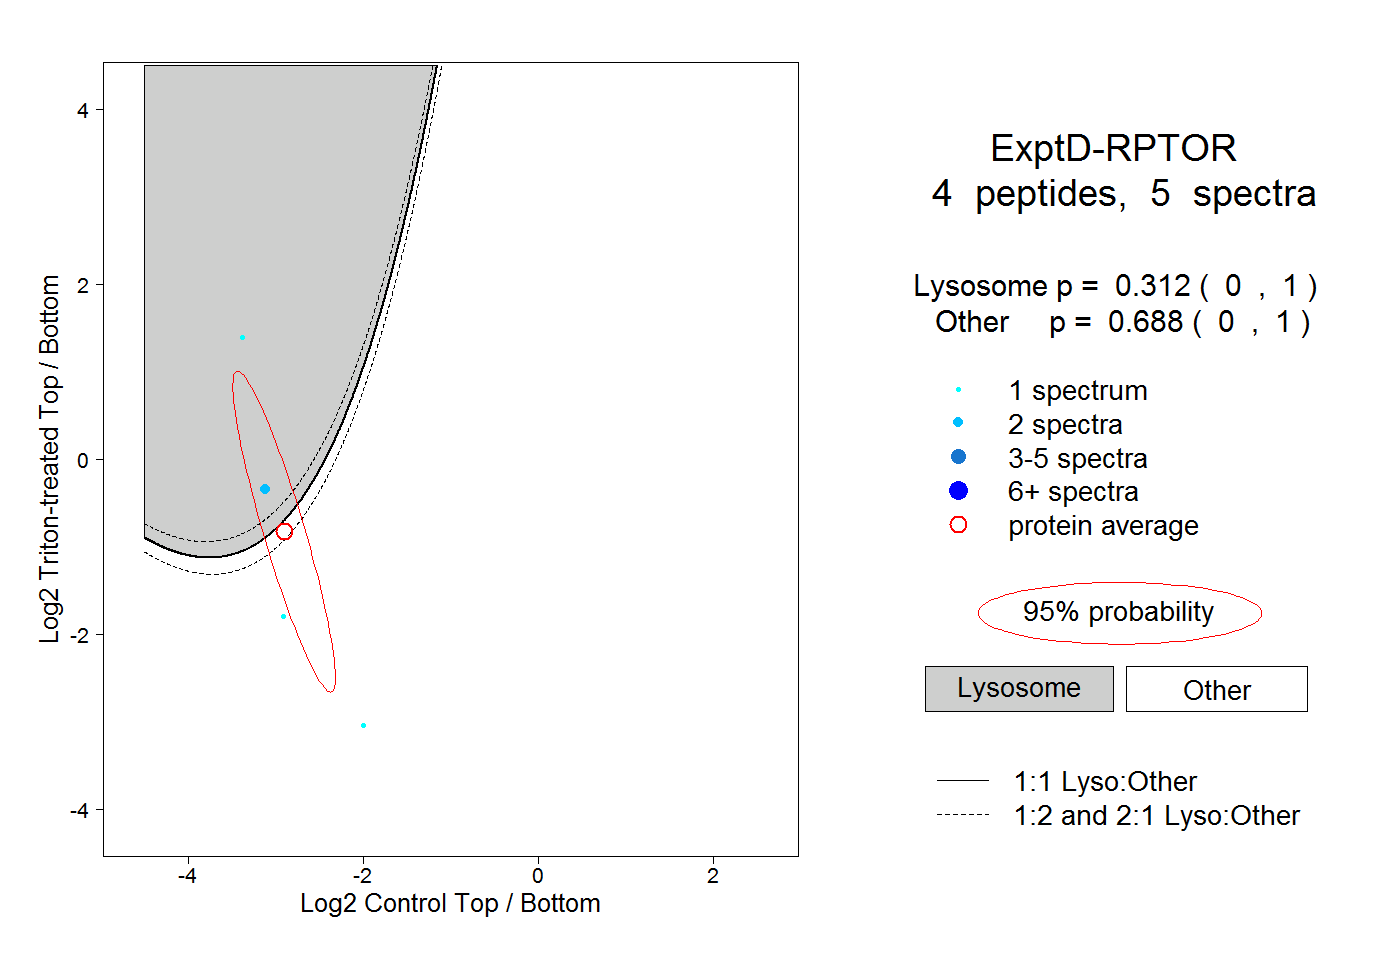
Lyso |
|
|
|
|
|
|
|
Other |
| Expt D |
4
peptides |
5
spectra |
 |
|
0.312
0.000 | 1.000 |
|
|
|
|
|
|
|
0.688
0.000 | 1.000 |