 2
2peptides
spectra
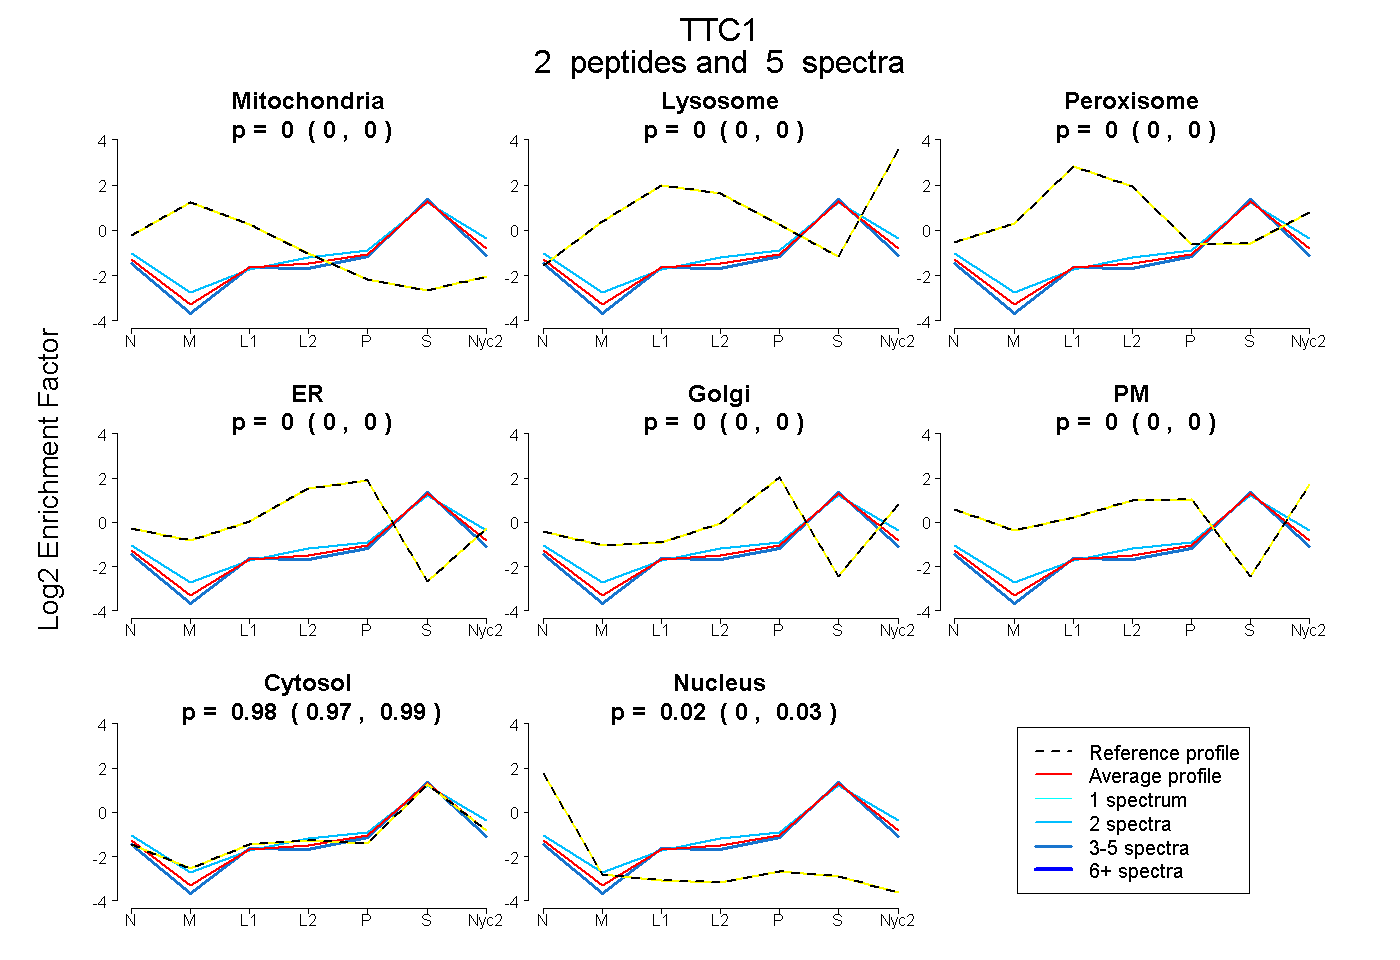
0.000 | 0.000
0.000 | 0.000
0.000 | 0.000
0.000 | 0.000
0.000 | 0.004
0.000 | 0.000
0.966 | 0.994
0.001 | 0.031
2peptides
spectra
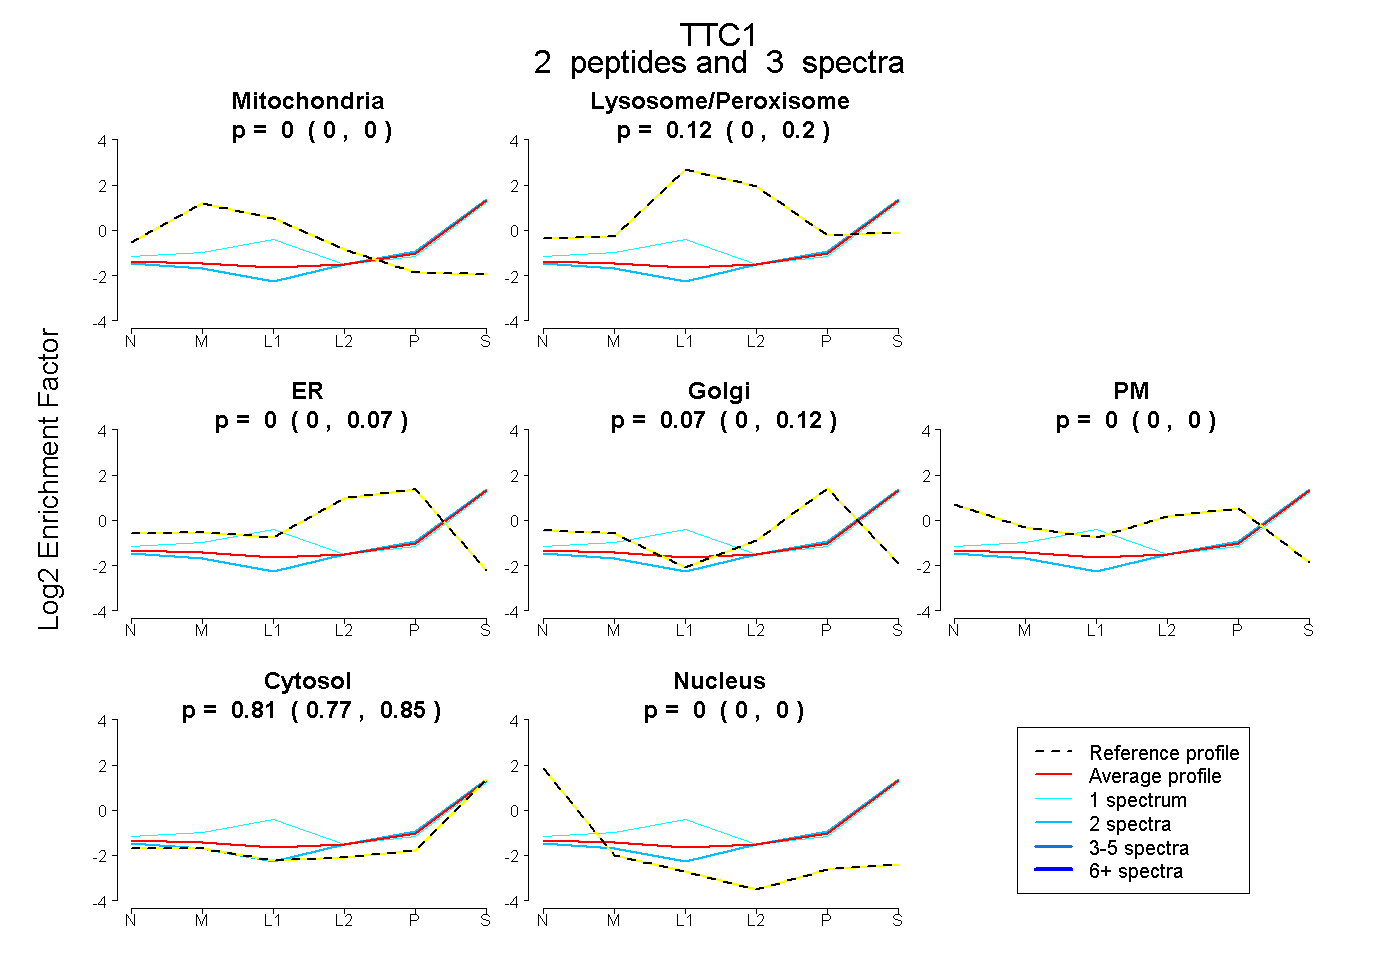
0.000 | 0.000
0.000 | 0.202
0.000 | 0.065
0.000 | 0.121
0.000 | 0.000
0.768 | 0.846
0.000 | 0.000
1peptide
spectrum

NA | NA
NA | NA