 10
10peptides
spectra
0.000 | 0.000
0.000 | 0.000
0.089 | 0.125
0.000 | 0.000
0.162 | 0.207
0.000 | 0.027
0.677 | 0.708
0.000 | 0.000
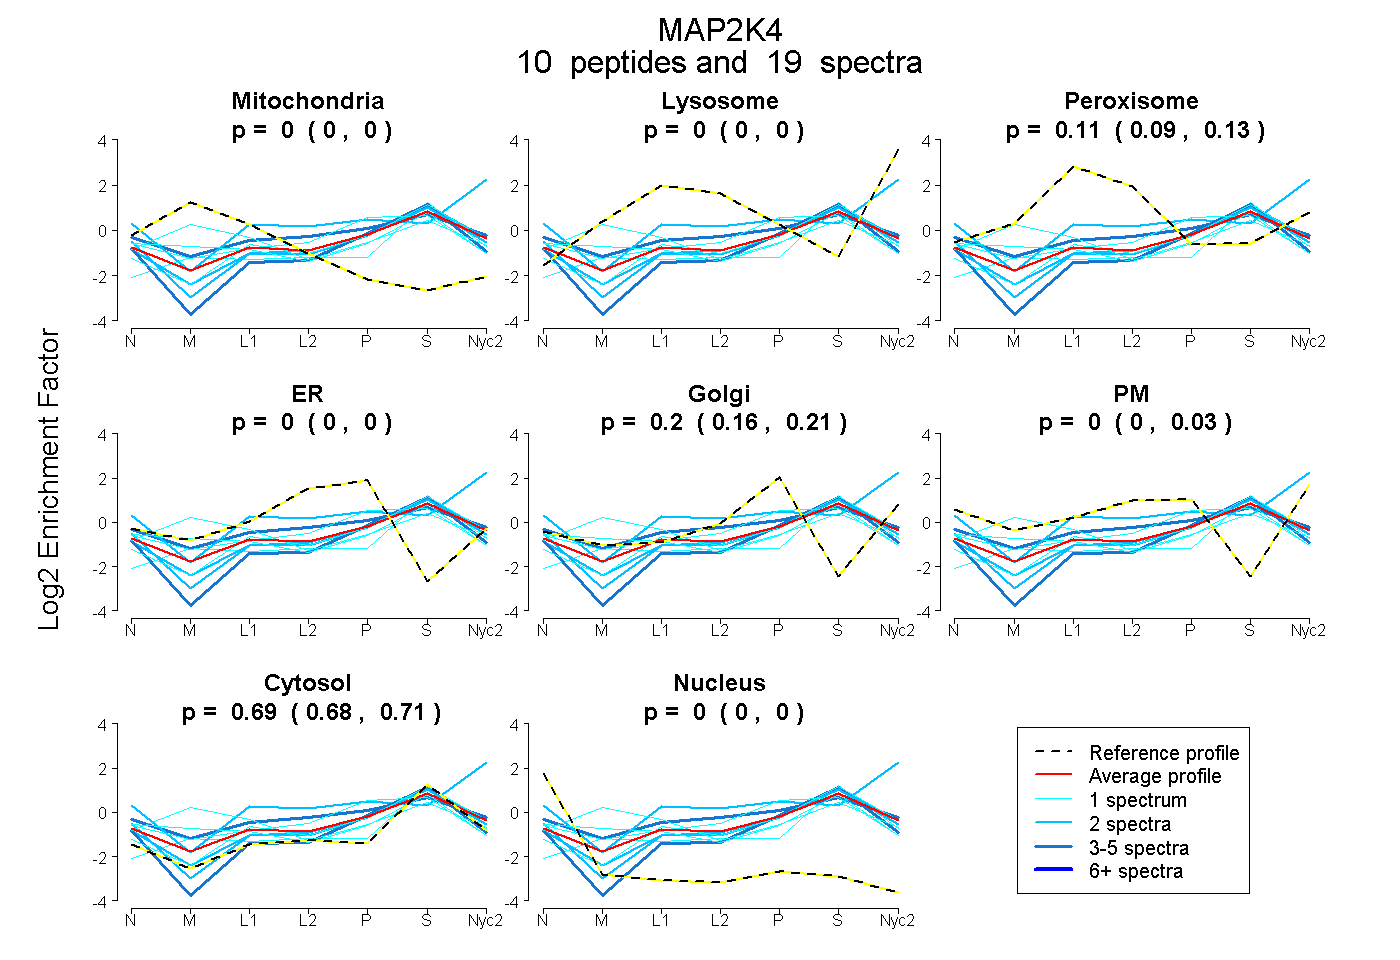
| Plot | Mito | Lyso | Perox | ER | Golgi | PM | Cytosol | Nucleus | |||||
| Expt A |
10 peptides |
19 spectra |
|
0.000 0.000 | 0.000 |
0.000 0.000 | 0.000 |
0.111 0.089 | 0.125 |
0.000 0.000 | 0.000 |
0.196 0.162 | 0.207 |
0.000 0.000 | 0.027 |
0.693 0.677 | 0.708 |
0.000 0.000 | 0.000 |
| 1 spectrum, STVDEK | 0.000 | 0.031 | 0.055 | 0.000 | 0.119 | 0.000 | 0.795 | 0.000 | ||
| 2 spectra, GAYGSVNK | 0.000 | 0.280 | 0.000 | 0.000 | 0.000 | 0.358 | 0.363 | 0.000 | ||
| 2 spectra, DIKPSNILLDR | 0.000 | 0.000 | 0.023 | 0.000 | 0.184 | 0.000 | 0.793 | 0.000 | ||
| 2 spectra, IDPSASR | 0.000 | 0.000 | 0.000 | 0.063 | 0.128 | 0.004 | 0.805 | 0.000 | ||
| 4 spectra, DAGCRPYMAPER | 0.000 | 0.000 | 0.182 | 0.037 | 0.118 | 0.103 | 0.561 | 0.000 | ||
| 1 spectrum, ALNHLK | 0.082 | 0.070 | 0.000 | 0.000 | 0.000 | 0.000 | 0.848 | 0.000 | ||
| 1 spectrum, QGYDVR | 0.000 | 0.000 | 0.010 | 0.350 | 0.009 | 0.000 | 0.632 | 0.000 | ||
| 1 spectrum, ITLATVK | 0.209 | 0.000 | 0.045 | 0.000 | 0.094 | 0.000 | 0.652 | 0.000 | ||
| 4 spectra, GDPPQLSNSEER | 0.000 | 0.000 | 0.000 | 0.000 | 0.096 | 0.000 | 0.882 | 0.022 | ||
| 1 spectrum, LNFANPPVK | 0.321 | 0.116 | 0.033 | 0.000 | 0.044 | 0.000 | 0.486 | 0.000 |
| Plot | Mito | Lyso or Perox | ER | Golgi | PM | Cytosol | Nucleus | ||||||
| Expt B |
4 peptides |
6 spectra |
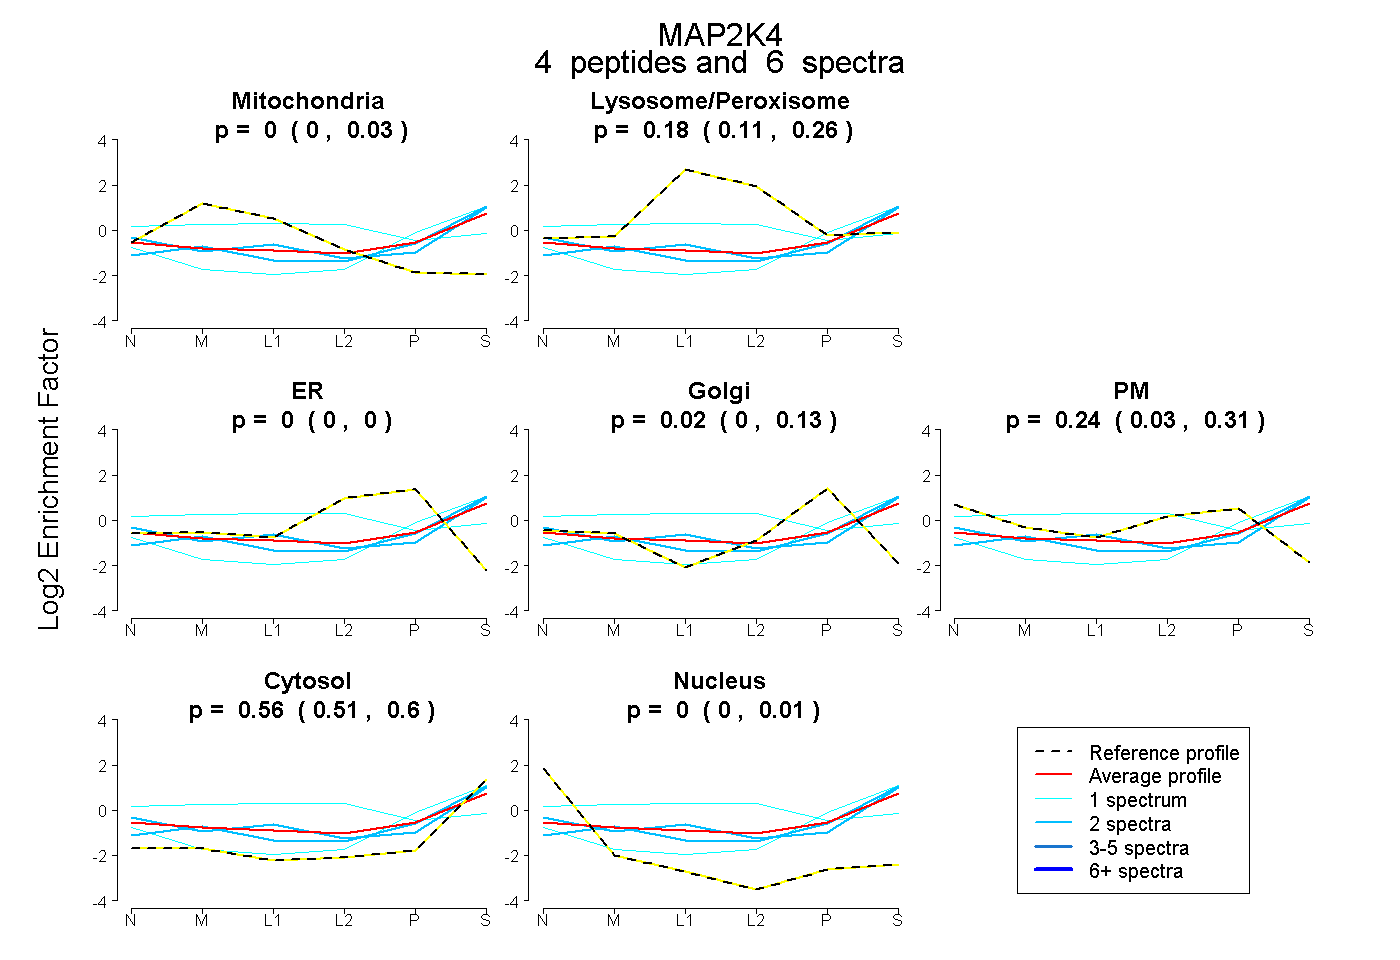 |
0.000 0.000 | 0.030 |
0.185 0.107 | 0.262 |
0.000 0.000 | 0.000 |
0.015 0.000 | 0.127 |
0.238 0.035 | 0.308 |
0.562 0.506 | 0.598 |
0.000 0.000 | 0.006 |
|||
| Plot | Lyso | Other | |||||||||||
| Expt C |
11 peptides |
36 spectra |
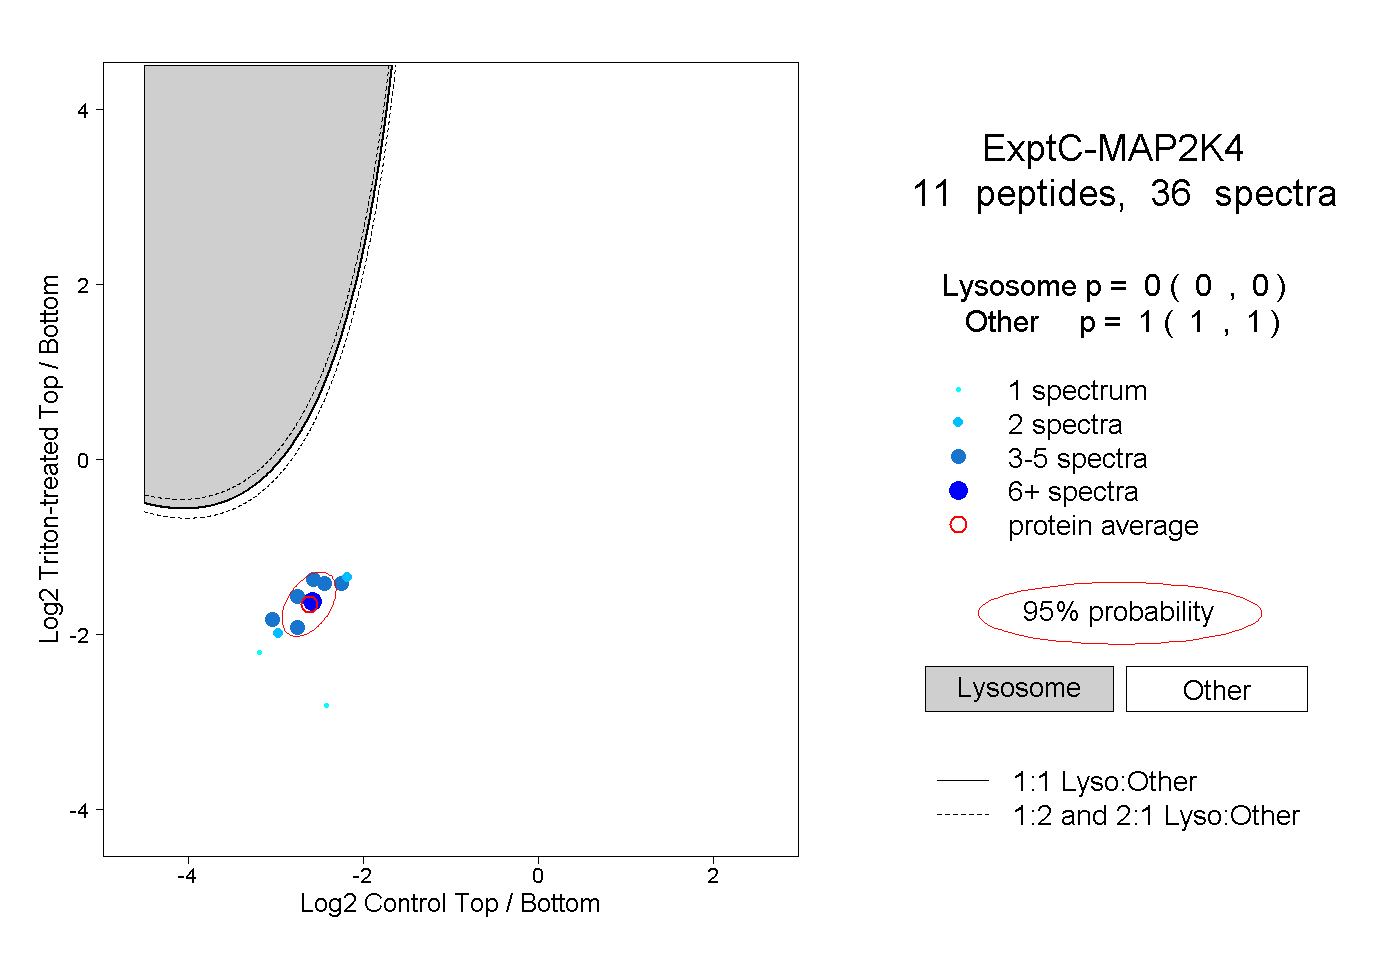 |
0.000 0.000 | 0.000 |
1.000 1.000 | 1.000 |
||||||||
| Plot | Lyso | Other | |||||||||||
| Expt D |
2 peptides |
3 spectra |
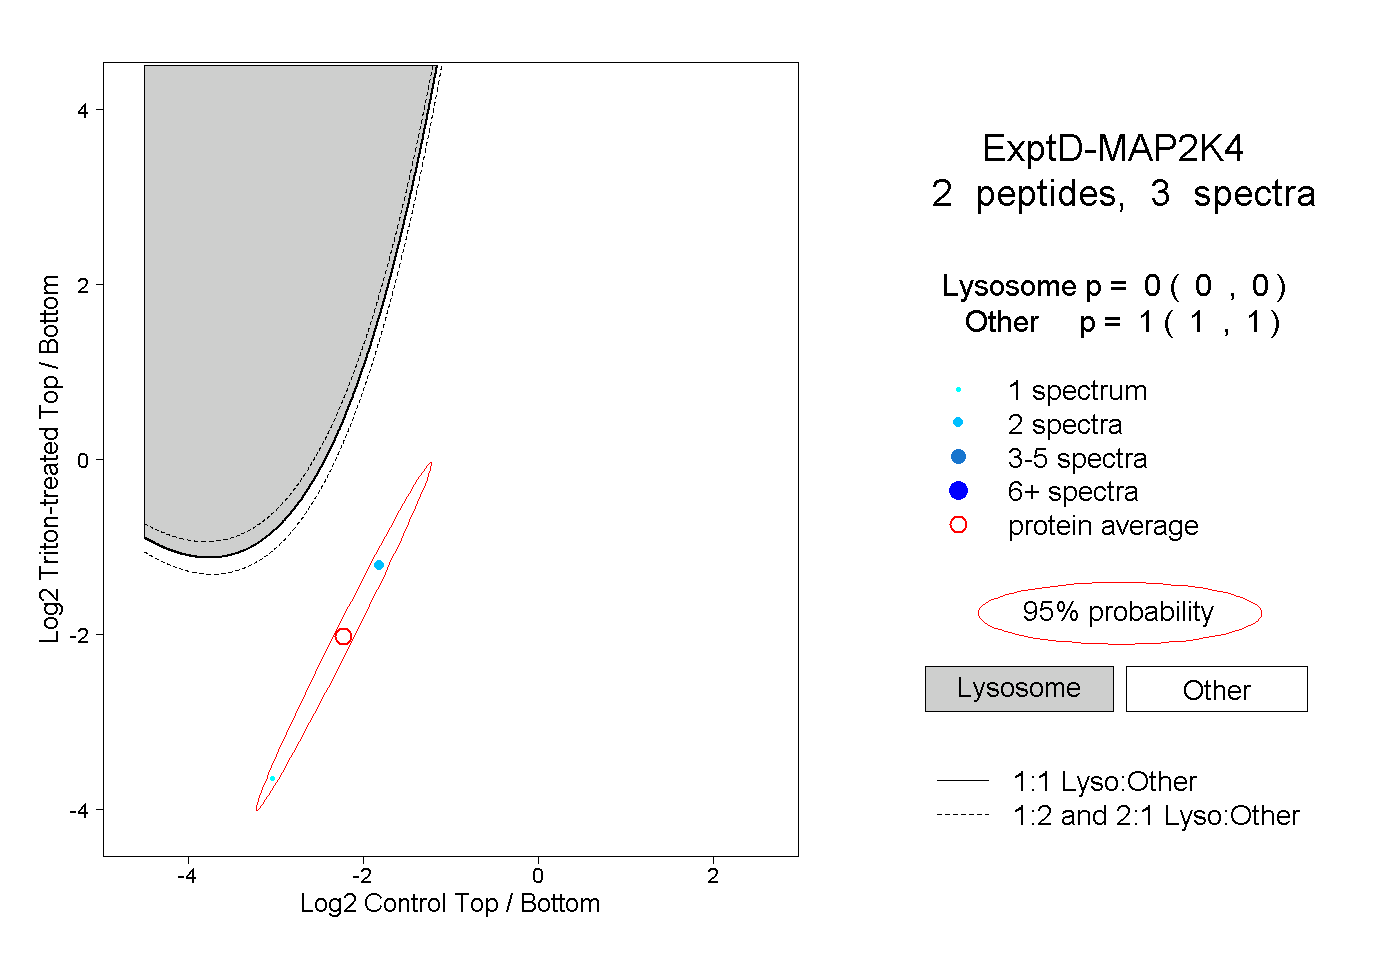 |
0.000 0.000 | 0.000 |
1.000 1.000 | 1.000 |