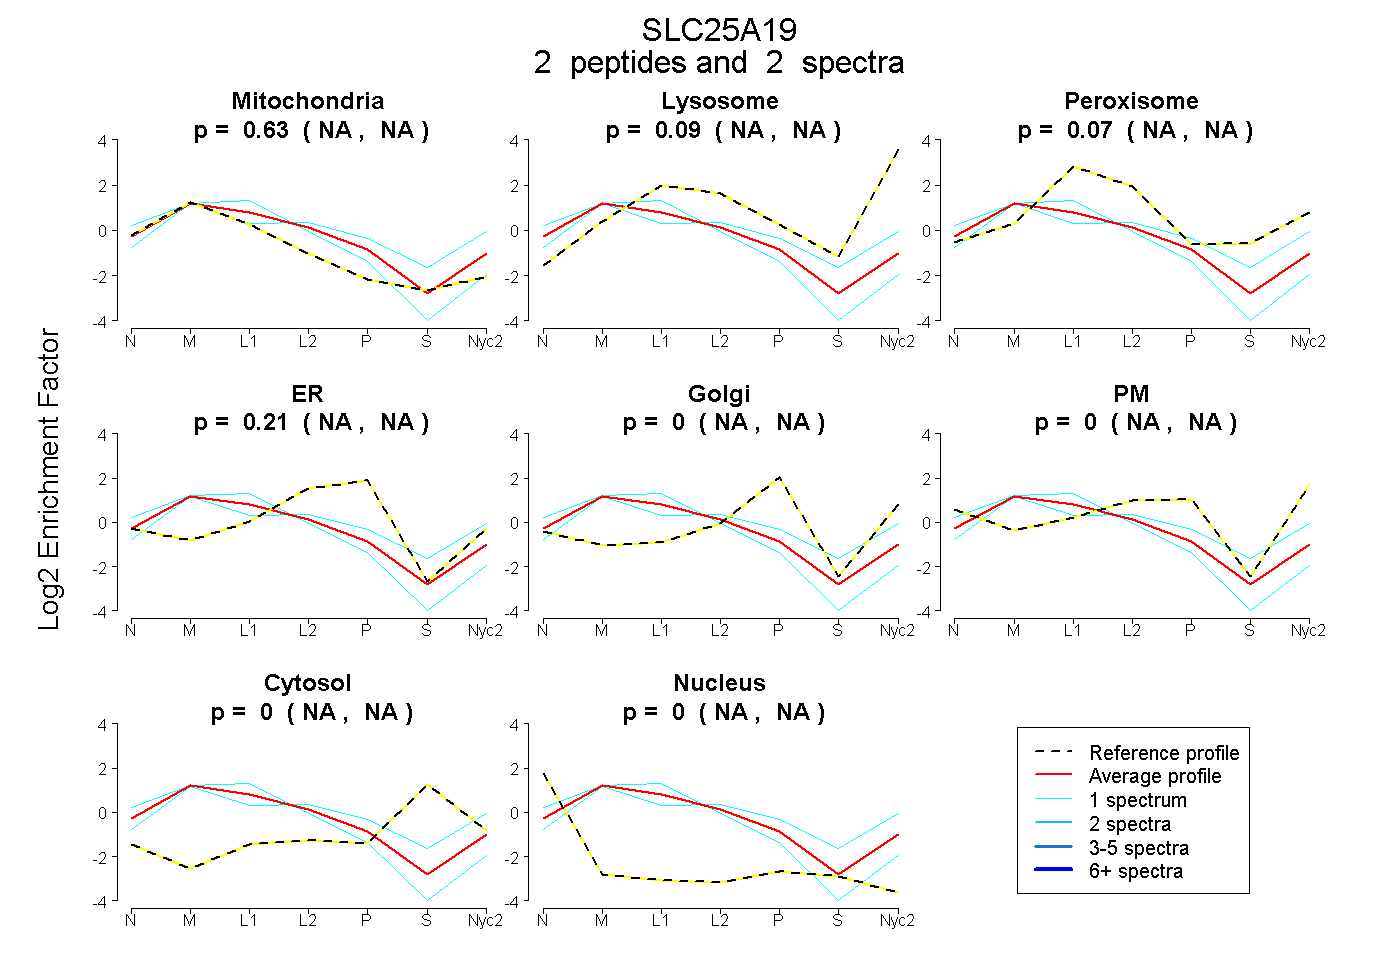
 2
2peptides
spectra
NA | NA
NA | NA
NA | NA
NA | NA
NA | NA
NA | NA
NA | NA
NA | NA
| Plot | Mito | Lyso | Perox | ER | Golgi | PM | Cytosol | Nucleus | |||||
| Expt A |
2 peptides |
2 spectra |
|
0.634 NA | NA |
0.085 NA | NA |
0.071 NA | NA |
0.209 NA | NA |
0.000 NA | NA |
0.000 NA | NA |
0.000 NA | NA |
0.000 NA | NA |
| 1 spectrum, TLTYPLDLFK | 0.480 | 0.304 | 0.000 | 0.160 | 0.030 | 0.000 | 0.026 | 0.000 | ||
| 1 spectrum, GLLDLAQQVLQHEGTR | 0.804 | 0.000 | 0.015 | 0.181 | 0.000 | 0.000 | 0.000 | 0.000 |
| Plot | Lyso | Other | |||||||||||
| Expt C |
10 peptides |
24 spectra |
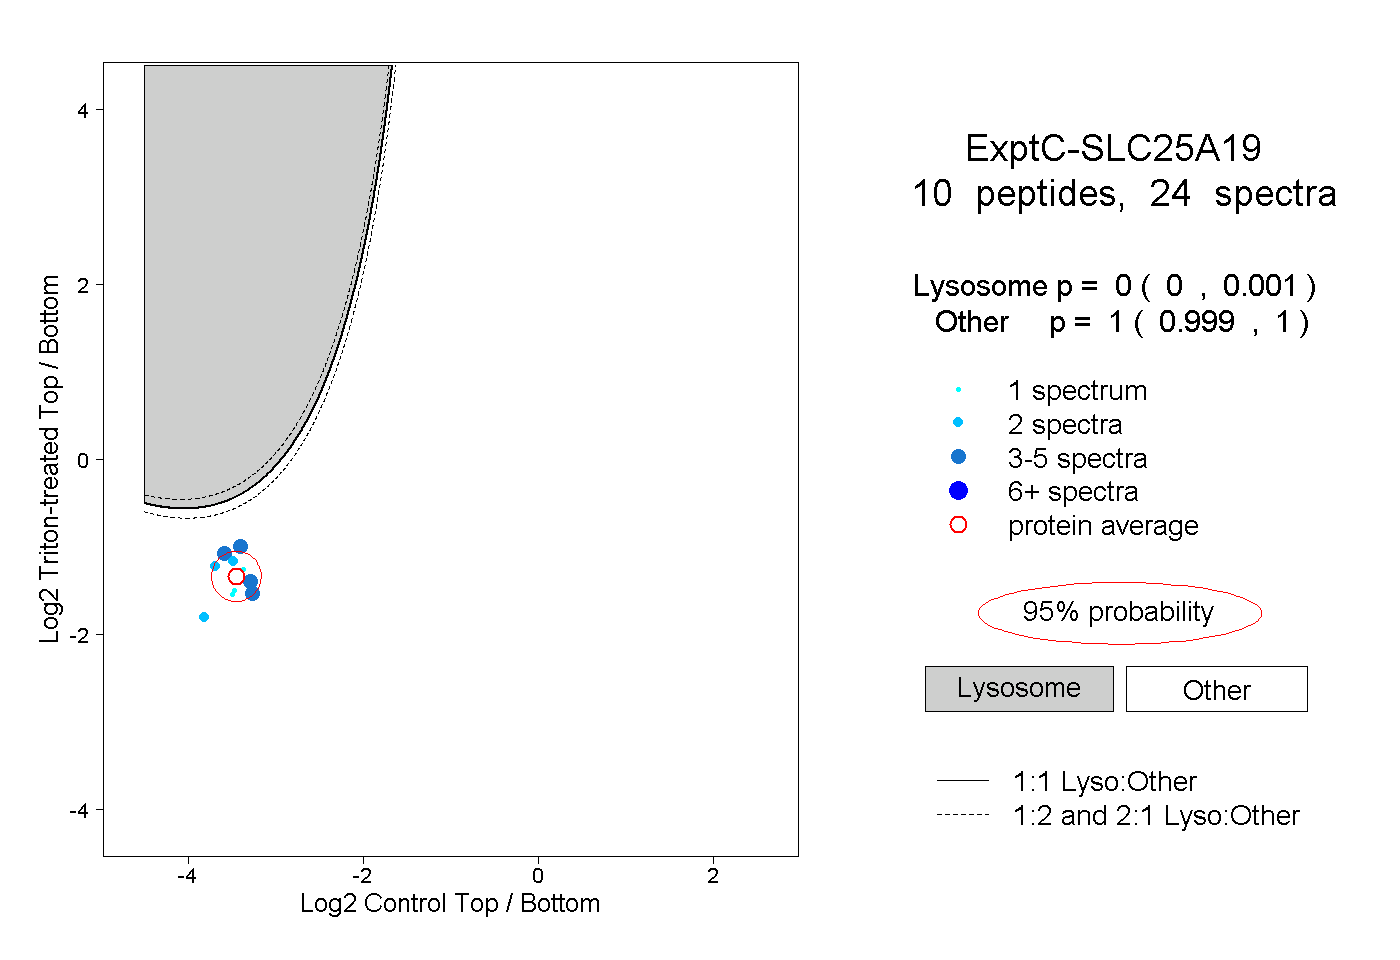 |
0.000 0.000 | 0.001 |
1.000 0.999 | 1.000 |