 4
4peptides
spectra

0.000 | 0.000
0.000 | 0.051
0.000 | 0.040
0.000 | 0.079
0.000 | 0.030
0.000 | 0.115
0.858 | 0.904
0.000 | 0.000
2peptides
spectra
NA | NA
NA | NA
| Plot | Mito | Lyso | Perox | ER | Golgi | PM | Cytosol | Nucleus | |||||
| Expt A |
4 peptides |
12 spectra |
|
0.000 0.000 | 0.000 |
0.013 0.000 | 0.051 |
0.000 0.000 | 0.040 |
0.012 0.000 | 0.079 |
0.000 0.000 | 0.030 |
0.089 0.000 | 0.115 |
0.886 0.858 | 0.904 |
0.000 0.000 | 0.000 |
||
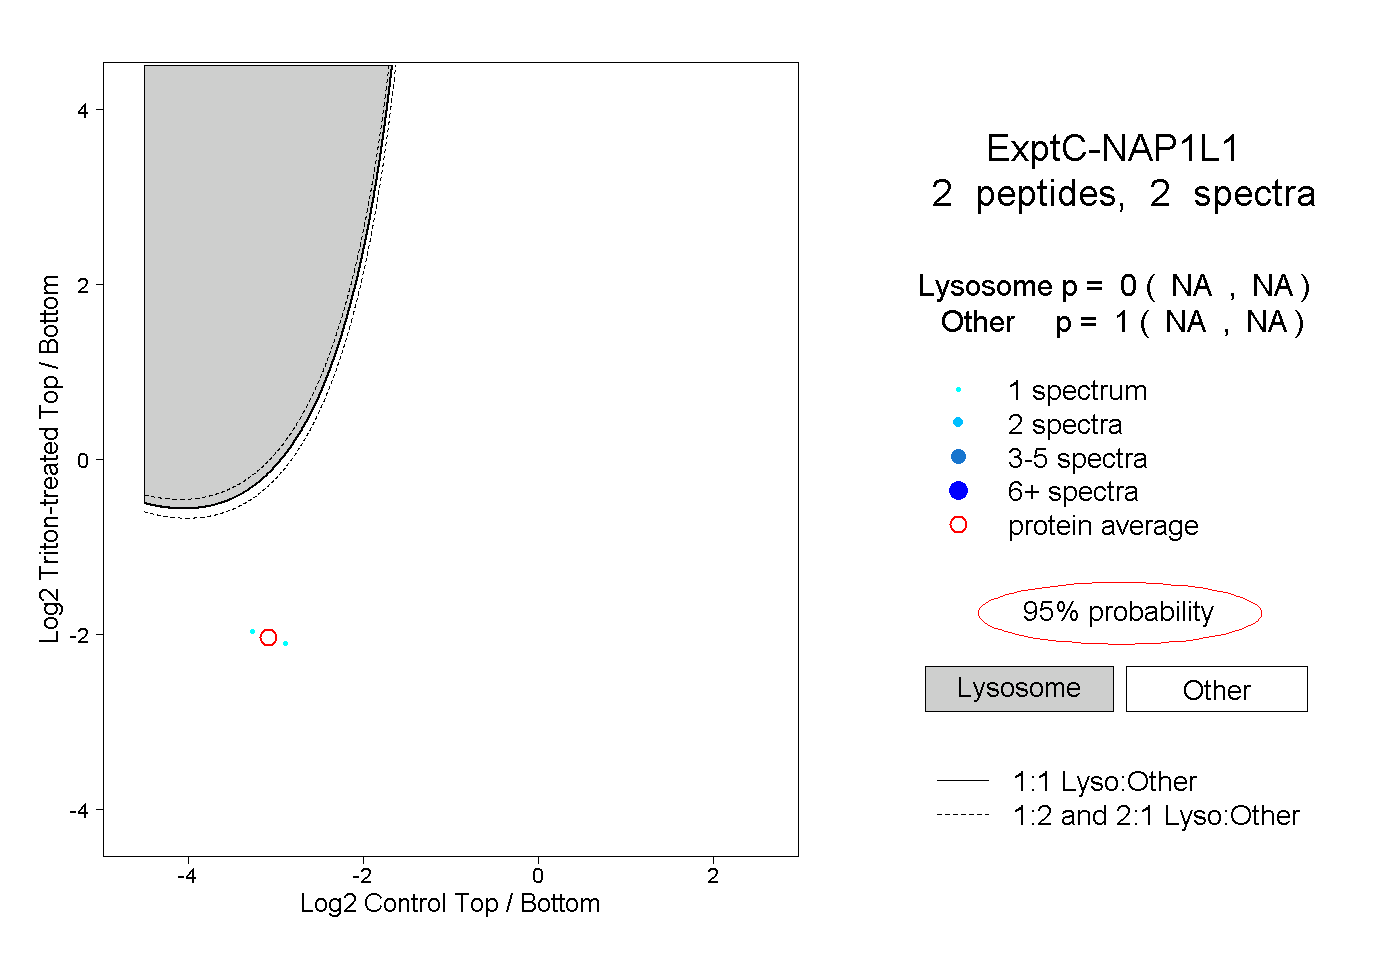
| Plot | Lyso | Other | |||||||||||
| Expt C |
2 peptides |
2 spectra |
|
0.000 NA | NA |
1.000 NA | NA |
| 1 spectrum, CAQIEAK | 0.000 | 1.000 | ||||||||
| 1 spectrum, NVDLLSDMVQEHDEPILK | 0.000 | 1.000 |