 4
4peptides
spectra
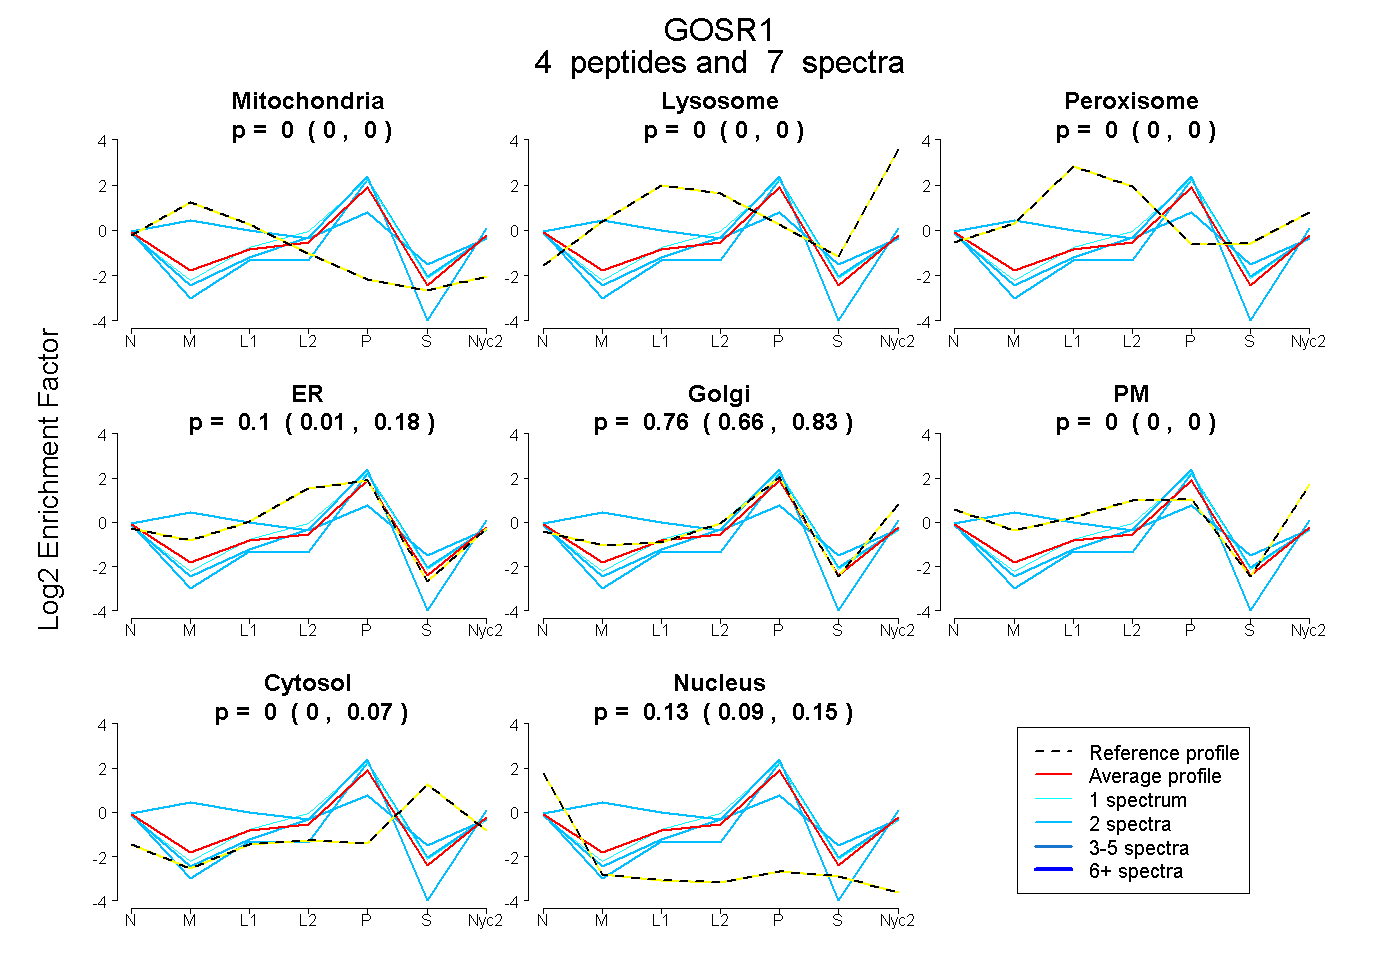
0.000 | 0.000
0.000 | 0.000
0.000 | 0.000
0.013 | 0.175
0.660 | 0.829
0.000 | 0.000
0.000 | 0.075
0.091 | 0.154
| Plot | Mito | Lyso | Perox | ER | Golgi | PM | Cytosol | Nucleus | |||||
| Expt A |
4 peptides |
7 spectra |
|
0.000 0.000 | 0.000 |
0.000 0.000 | 0.000 |
0.000 0.000 | 0.000 |
0.102 0.013 | 0.175 |
0.761 0.660 | 0.829 |
0.000 0.000 | 0.000 |
0.003 0.000 | 0.075 |
0.135 0.091 | 0.154 |
| 1 spectrum, EHDHLR | 0.000 | 0.000 | 0.000 | 0.265 | 0.591 | 0.000 | 0.065 | 0.079 | ||
| 2 spectra, DILQDYTHEFHK | 0.000 | 0.000 | 0.000 | 0.000 | 0.757 | 0.000 | 0.074 | 0.169 | ||
| 2 spectra, FPAVNSLIQR | 0.000 | 0.000 | 0.000 | 0.056 | 0.836 | 0.000 | 0.000 | 0.108 | ||
| 2 spectra, LIEETISIAMATK | 0.308 | 0.000 | 0.153 | 0.000 | 0.515 | 0.000 | 0.023 | 0.000 |
| Plot | Lyso | Other | |||||||||||
| Expt C |
8 peptides |
15 spectra |
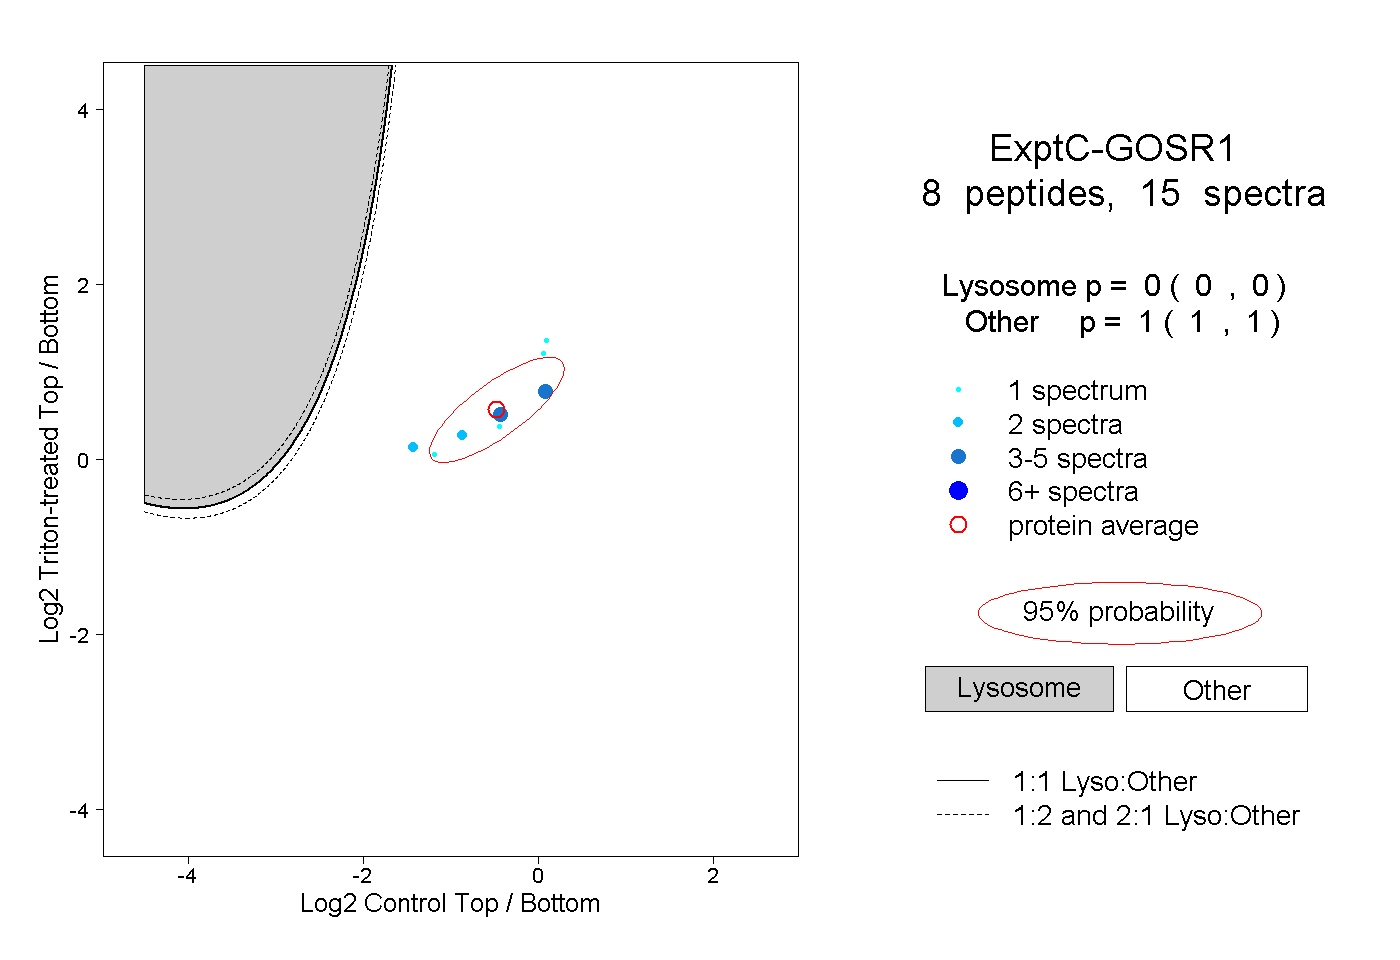 |
0.000 0.000 | 0.000 |
1.000 1.000 | 1.000 |