 18
18peptides
spectra
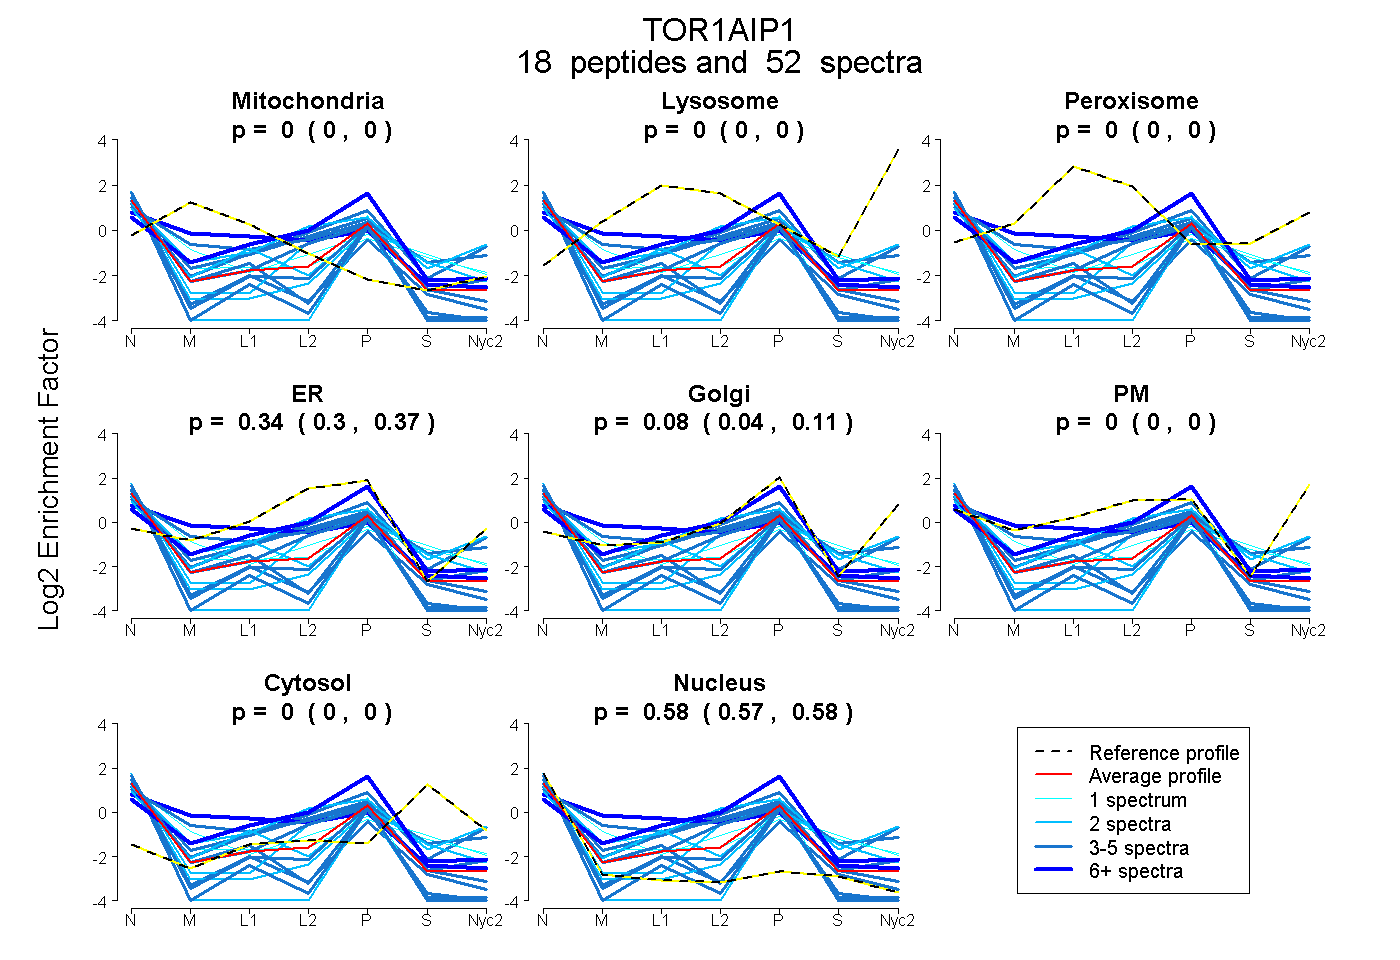
0.000 | 0.000
0.000 | 0.000
0.000 | 0.000
0.304 | 0.374
0.043 | 0.114
0.000 | 0.000
0.000 | 0.000
0.567 | 0.582
3peptides
spectra
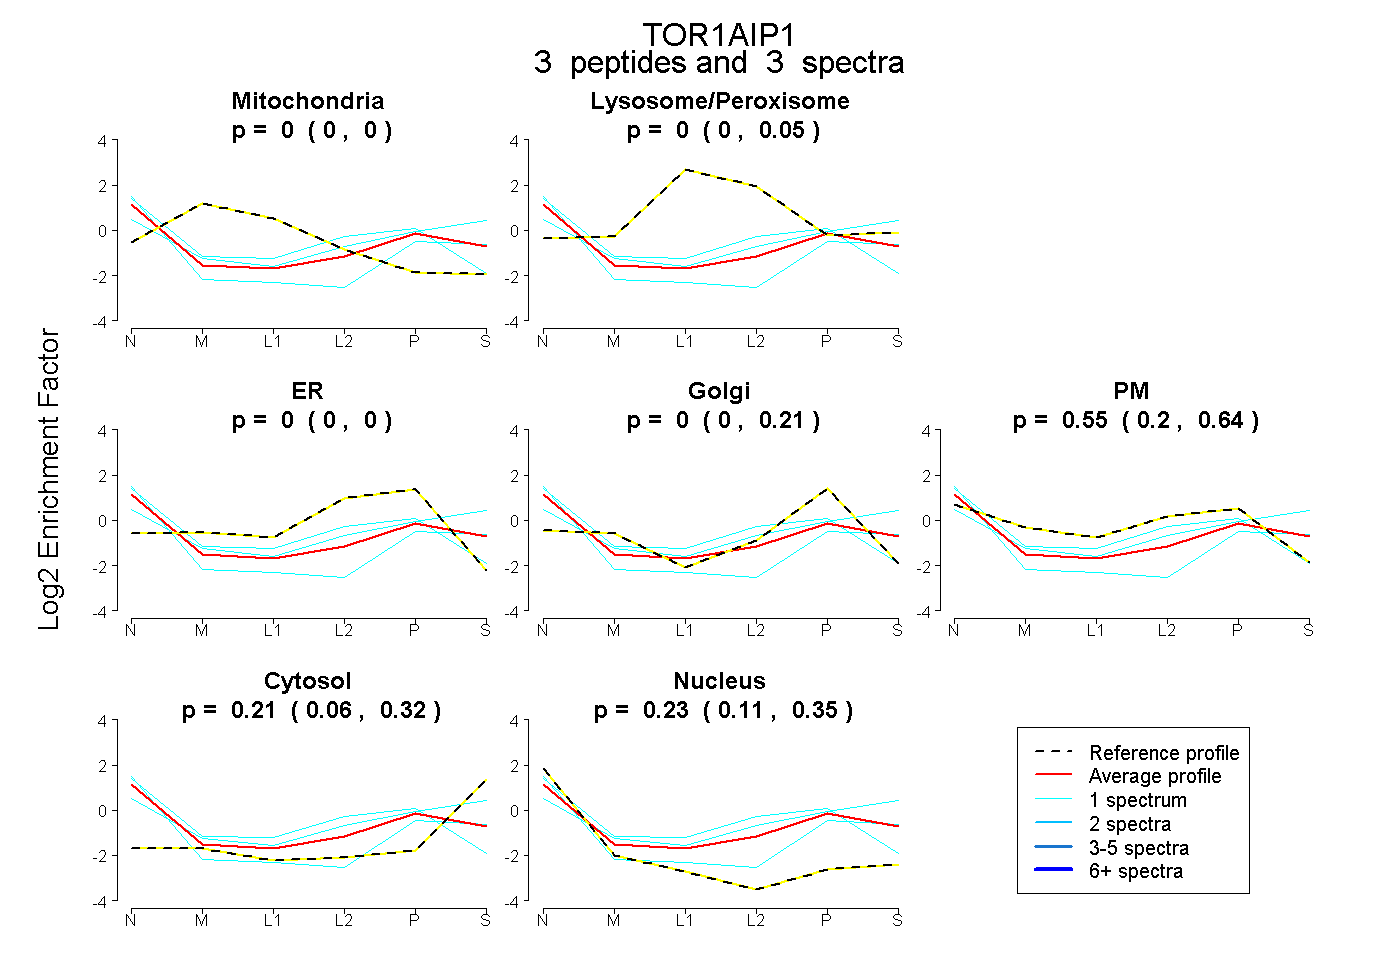
0.000 | 0.000
0.000 | 0.051
0.000 | 0.000
0.000 | 0.213
0.196 | 0.637
0.061 | 0.319
0.113 | 0.351
4peptides
spectra
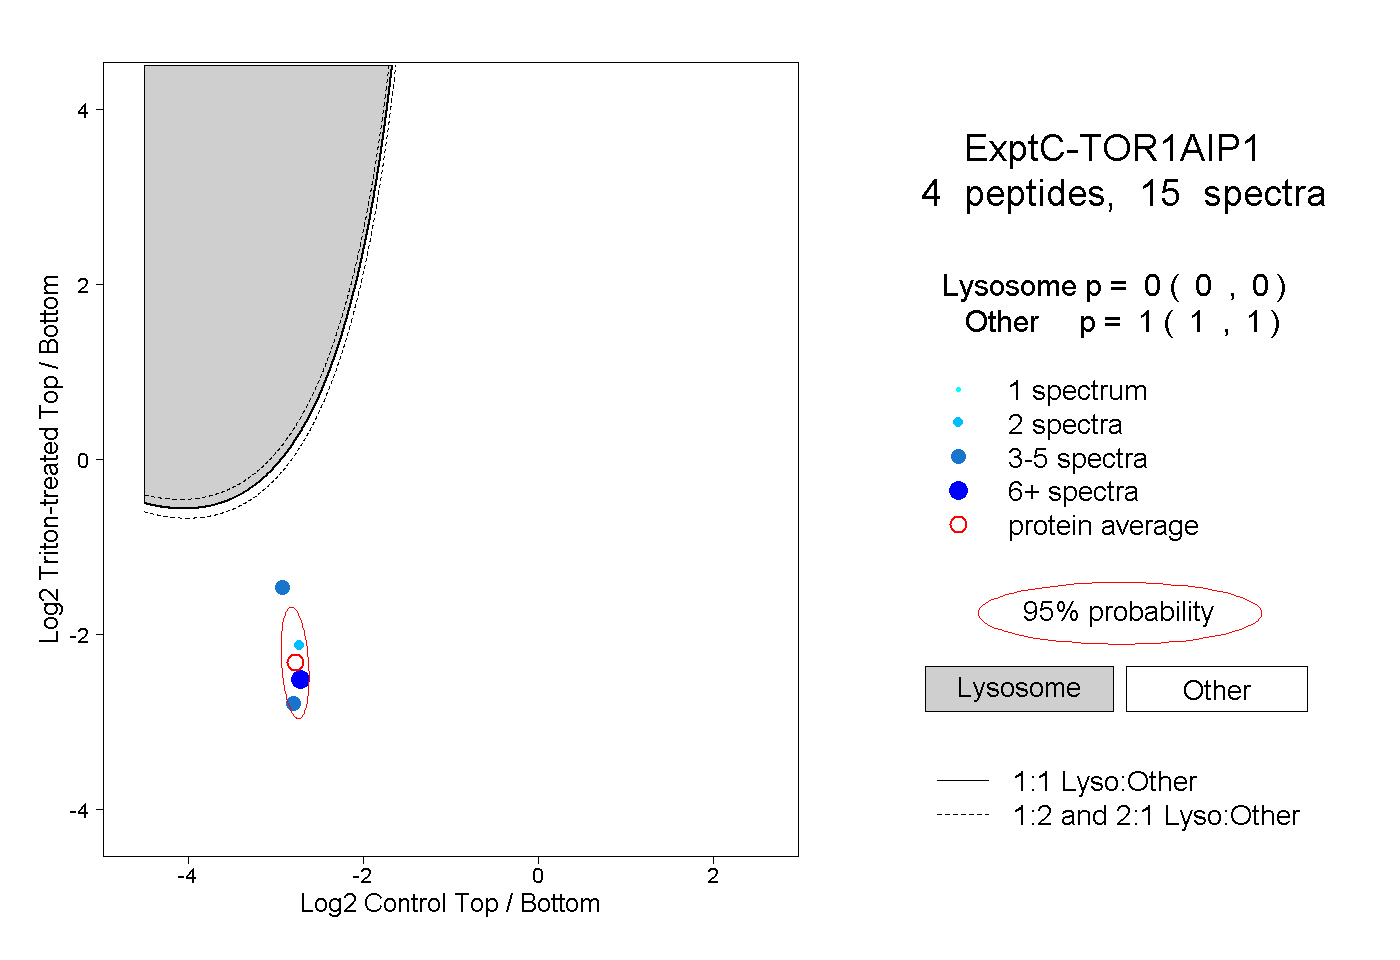
0.000 | 0.000
1.000 | 1.000
2peptides
spectra
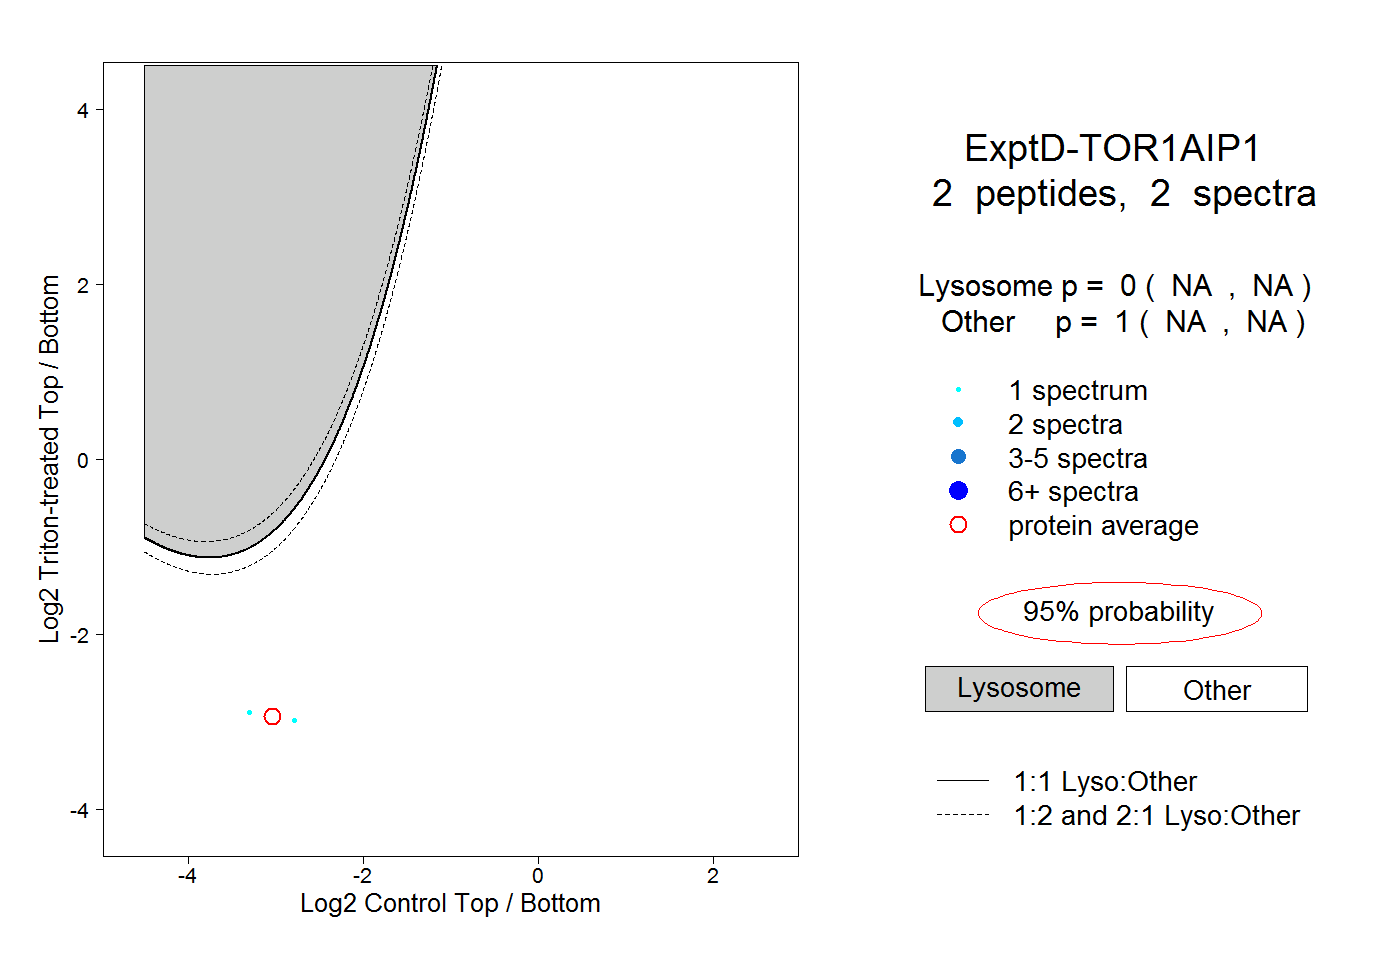
NA | NA
NA | NA