 3
3peptides
spectra
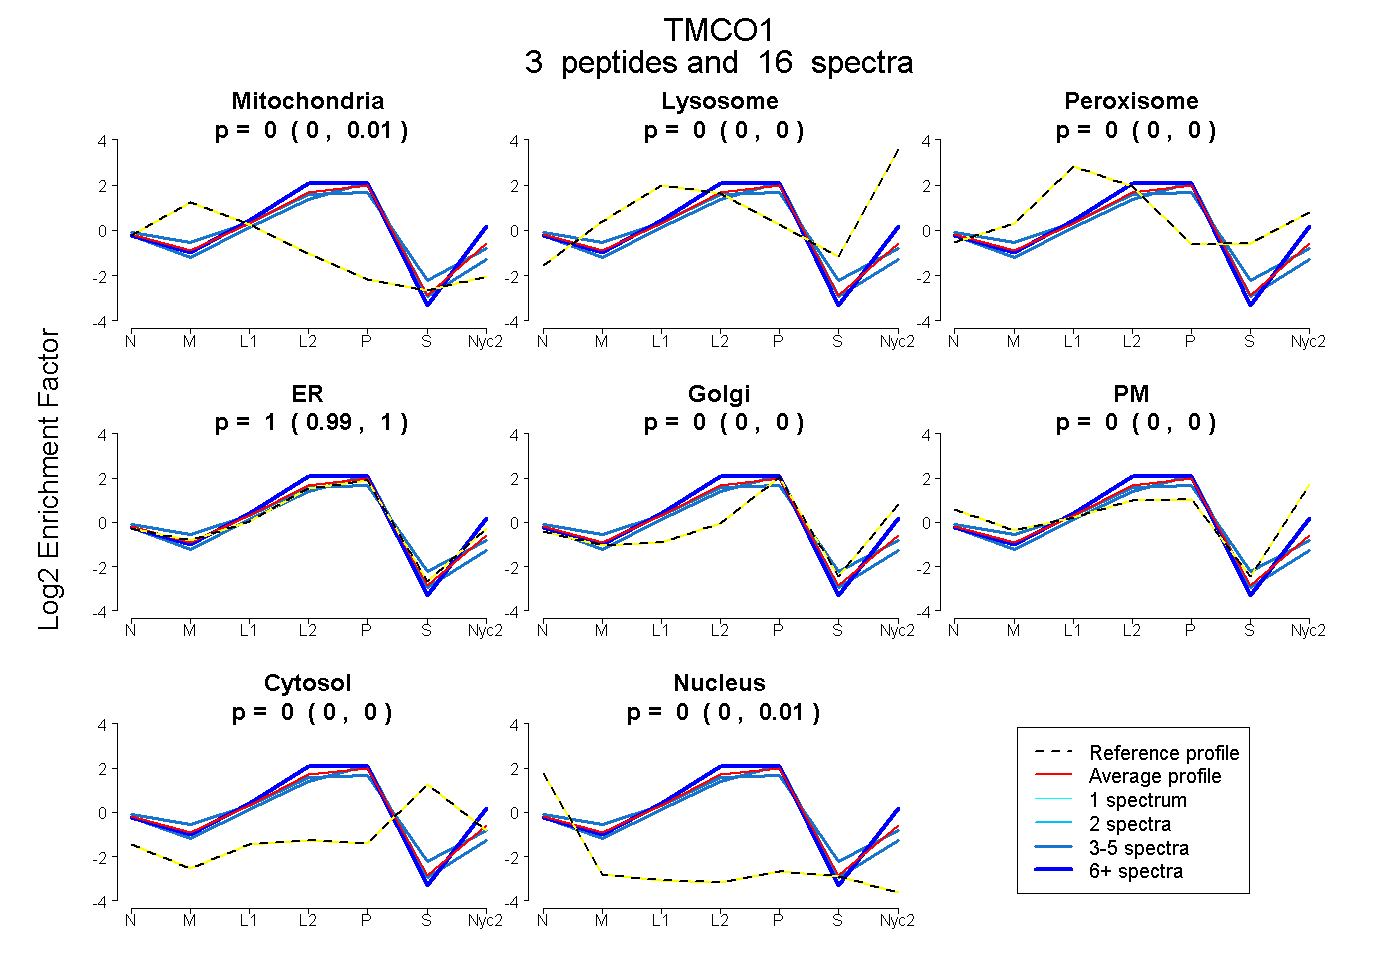
0.000 | 0.006
0.000 | 0.000
0.000 | 0.005
0.985 | 1.000
0.000 | 0.000
0.000 | 0.000
0.000 | 0.000
0.000 | 0.007
4peptides
spectra
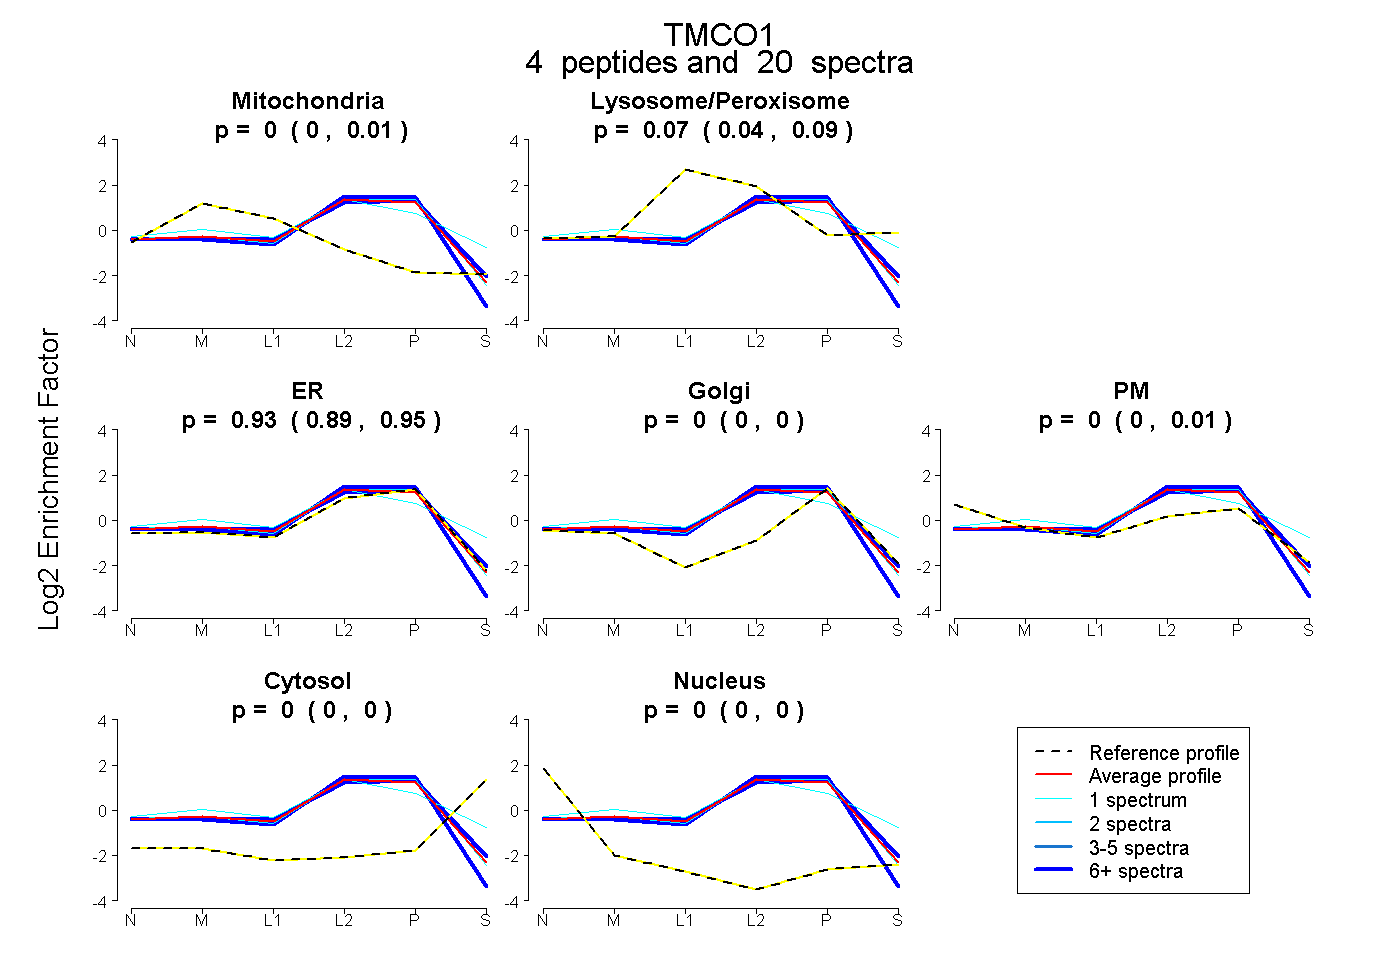
0.000 | 0.009
0.043 | 0.092
0.894 | 0.949
0.000 | 0.000
0.000 | 0.009
0.000 | 0.000
0.000 | 0.000

