 3
3peptides
spectra
0.000 | 0.111
0.000 | 0.000
0.000 | 0.000
0.000 | 0.000
0.000 | 0.000
0.000 | 0.000
0.859 | 0.980
0.000 | 0.105
| Plot | Mito | Lyso | Perox | ER | Golgi | PM | Cytosol | Nucleus | |||||
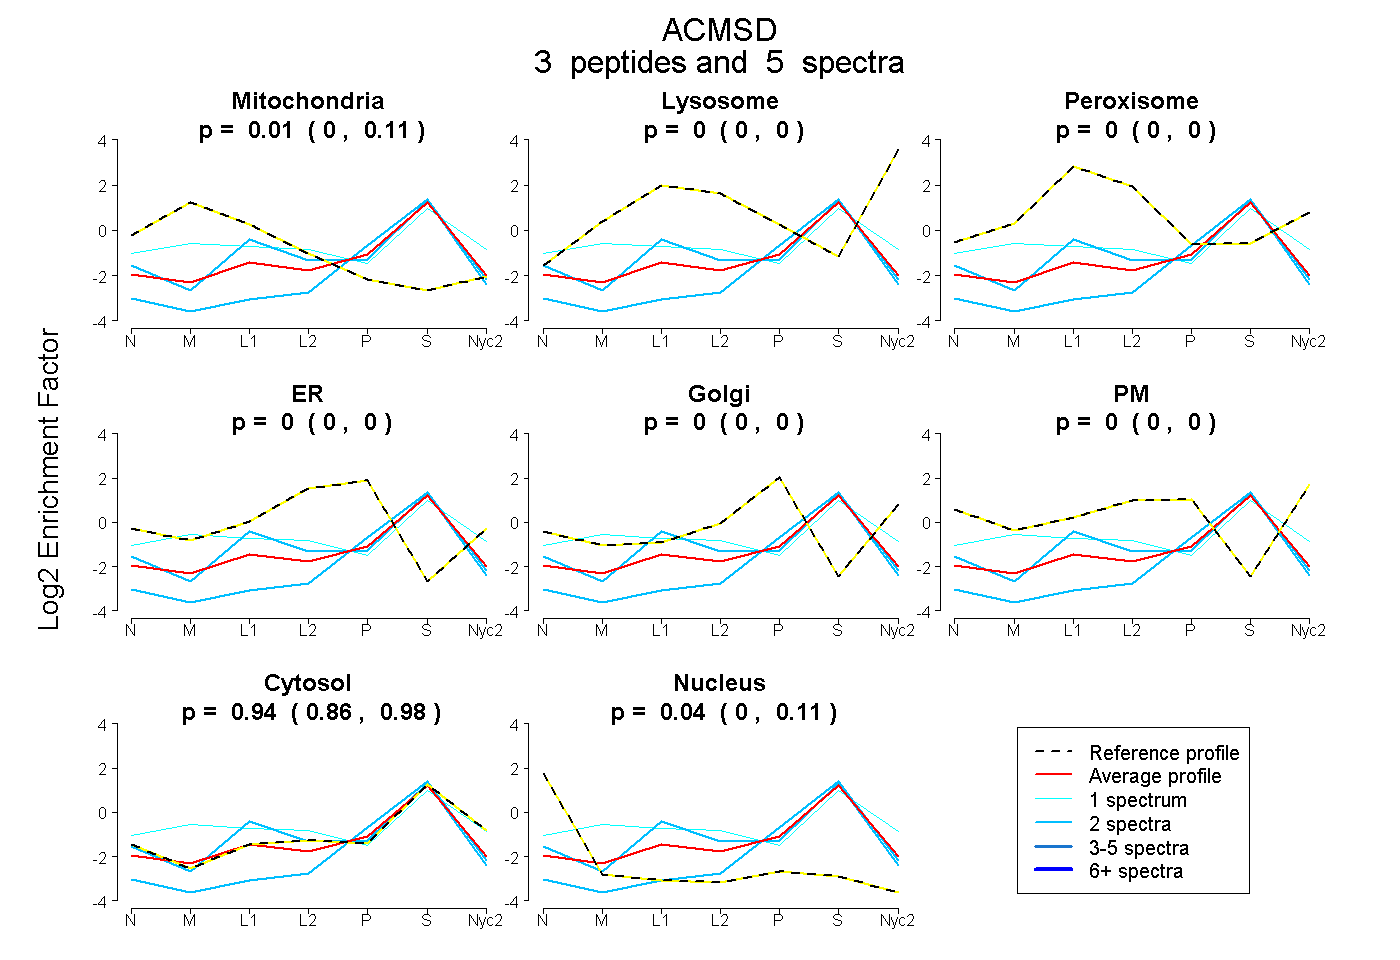
| Expt A |
3 peptides |
5 spectra |
|
0.015 0.000 | 0.111 |
0.000 0.000 | 0.000 |
0.000 0.000 | 0.000 |
0.000 0.000 | 0.000 |
0.000 0.000 | 0.000 |
0.000 0.000 | 0.000 |
0.942 0.859 | 0.980 |
0.043 0.000 | 0.105 |
| 2 spectra, VCFAHGGGAFPFTIGR | 0.069 | 0.000 | 0.000 | 0.000 | 0.000 | 0.000 | 0.917 | 0.014 | ||
| 2 spectra, LTAGNALTFLGLER | 0.000 | 0.000 | 0.000 | 0.000 | 0.000 | 0.000 | 0.930 | 0.070 | ||
| 1 spectrum, IAHGFNMRPDLCAR | 0.199 | 0.000 | 0.137 | 0.000 | 0.000 | 0.000 | 0.664 | 0.000 |
| Plot | Mito | Lyso or Perox | ER | Golgi | PM | Cytosol | Nucleus | ||||||
| Expt B |
1 peptide |
4 spectra |
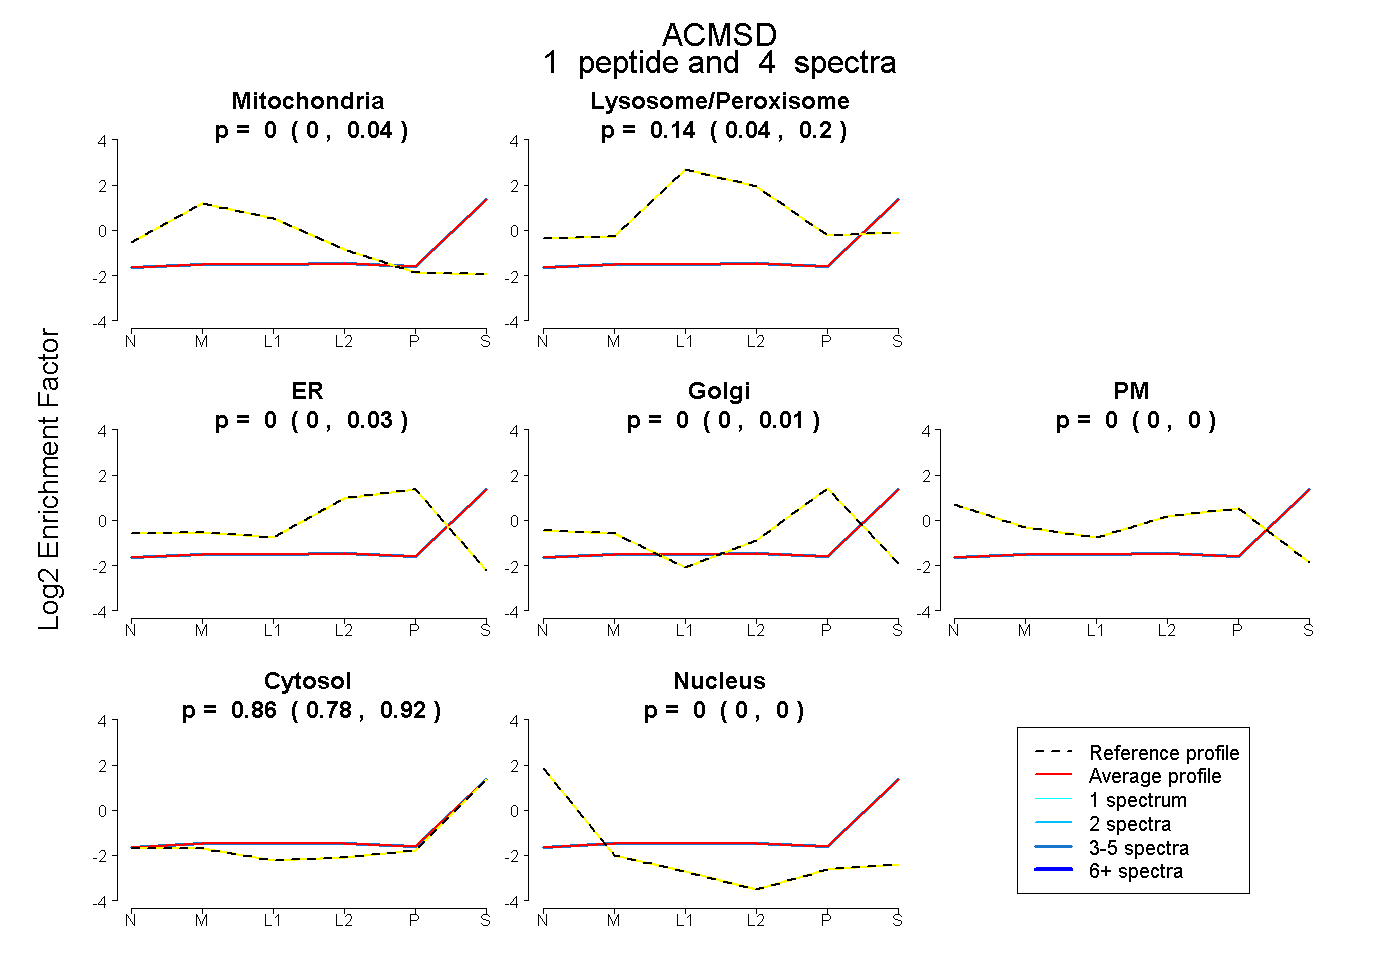 |
0.000 0.000 | 0.038 |
0.136 0.039 | 0.201 |
0.000 0.000 | 0.028 |
0.000 0.000 | 0.013 |
0.000 0.000 | 0.000 |
0.864 0.783 | 0.921 |
0.000 0.000 | 0.002 |
|||
| Plot | Lyso | Other | |||||||||||
| Expt C |
2 peptides |
4 spectra |
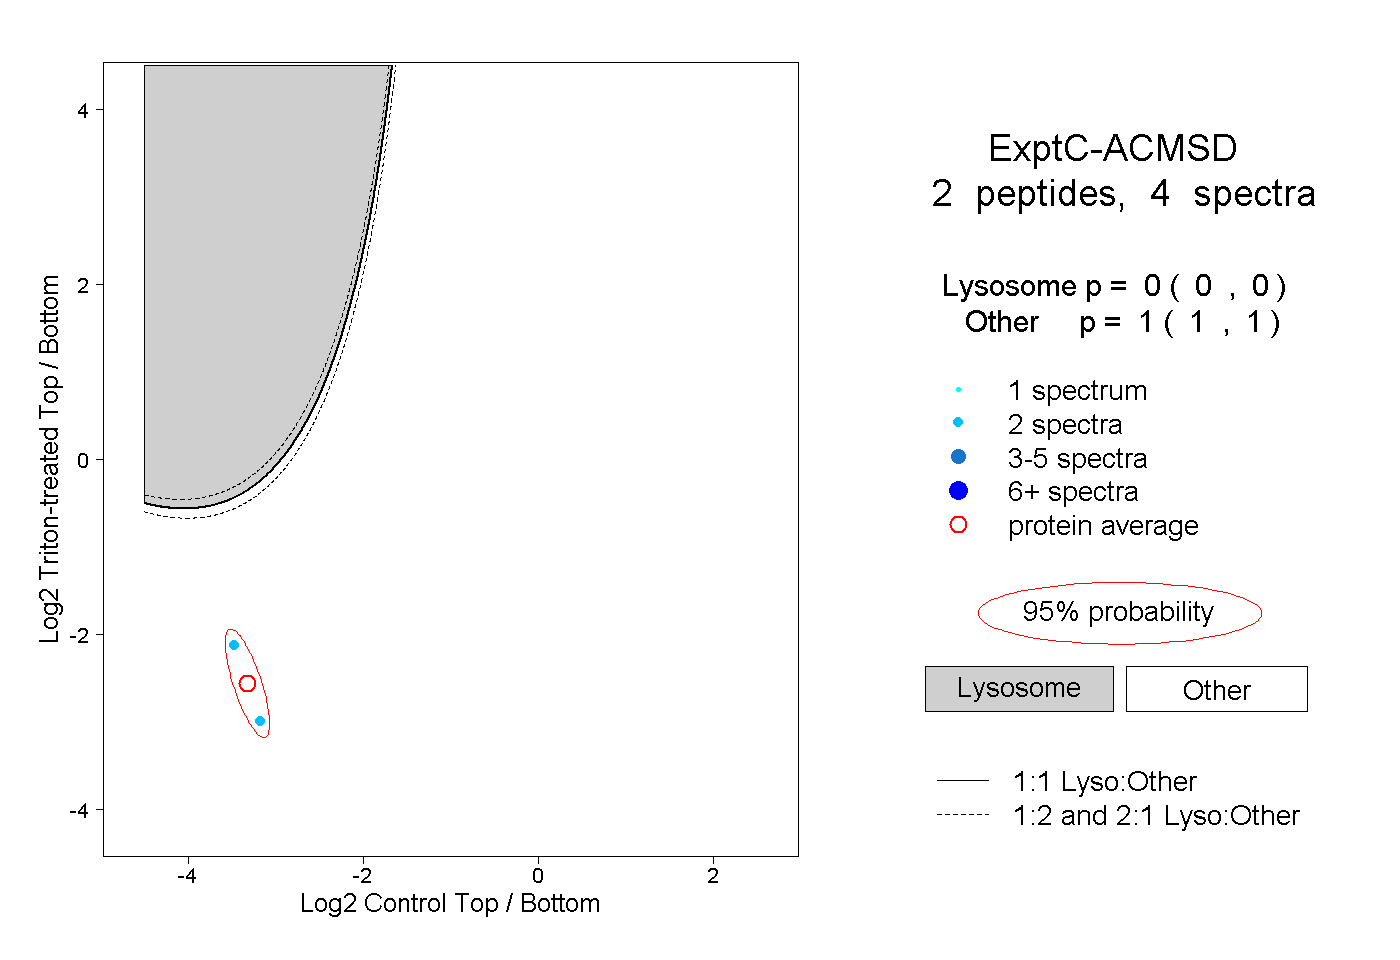 |
0.000 0.000 | 0.000 |
1.000 1.000 | 1.000 |