 4
4peptides
spectra
0.000 | 0.000
0.000 | 0.000
0.000 | 0.000
0.000 | 0.293
0.000 | 0.317
0.000 | 0.000
0.516 | 0.583
0.091 | 0.240
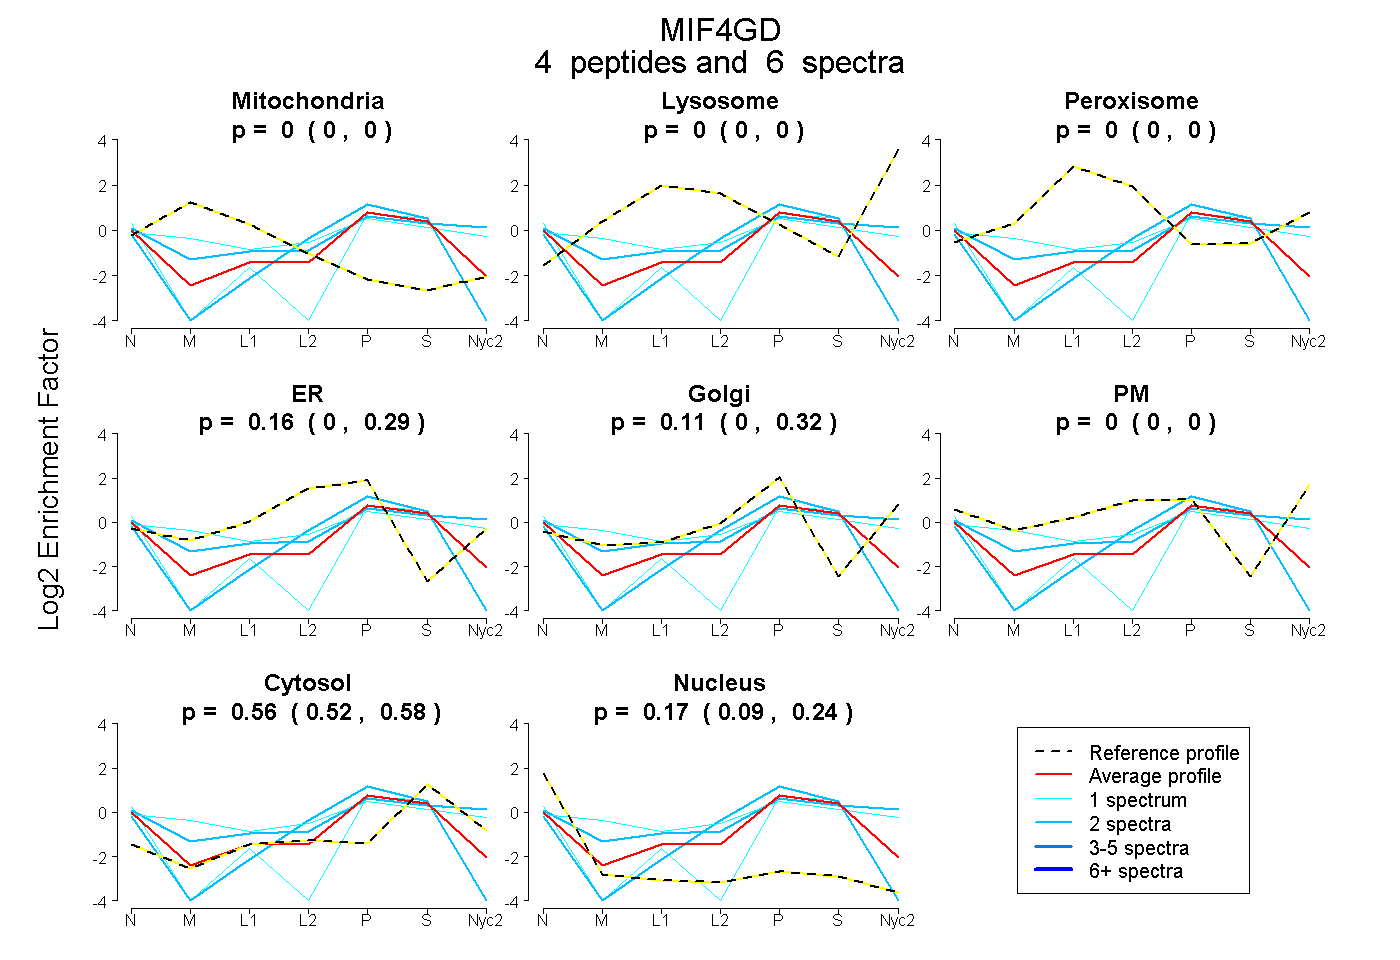
| Plot | Mito | Lyso | Perox | ER | Golgi | PM | Cytosol | Nucleus | |||||
| Expt A |
4 peptides |
6 spectra |
|
0.000 0.000 | 0.000 |
0.000 0.000 | 0.000 |
0.000 0.000 | 0.000 |
0.161 0.000 | 0.293 |
0.106 0.000 | 0.317 |
0.000 0.000 | 0.000 |
0.560 0.516 | 0.583 |
0.174 0.091 | 0.240 |
| 1 spectrum, TTPAAHK | 0.089 | 0.000 | 0.084 | 0.000 | 0.316 | 0.098 | 0.414 | 0.000 | ||
| 2 spectra, EEEVDCLVLQLHR | 0.000 | 0.000 | 0.000 | 0.206 | 0.000 | 0.000 | 0.532 | 0.262 | ||
| 1 spectrum, DGFLLPIDLSSLAR | 0.000 | 0.000 | 0.000 | 0.000 | 0.000 | 0.000 | 0.525 | 0.475 | ||
| 2 spectra, IQSFDAETQQLLK | 0.000 | 0.000 | 0.000 | 0.000 | 0.250 | 0.221 | 0.528 | 0.000 |
| Plot | Mito | Lyso or Perox | ER | Golgi | PM | Cytosol | Nucleus | ||||||
| Expt B |
1 peptide |
1 spectrum |
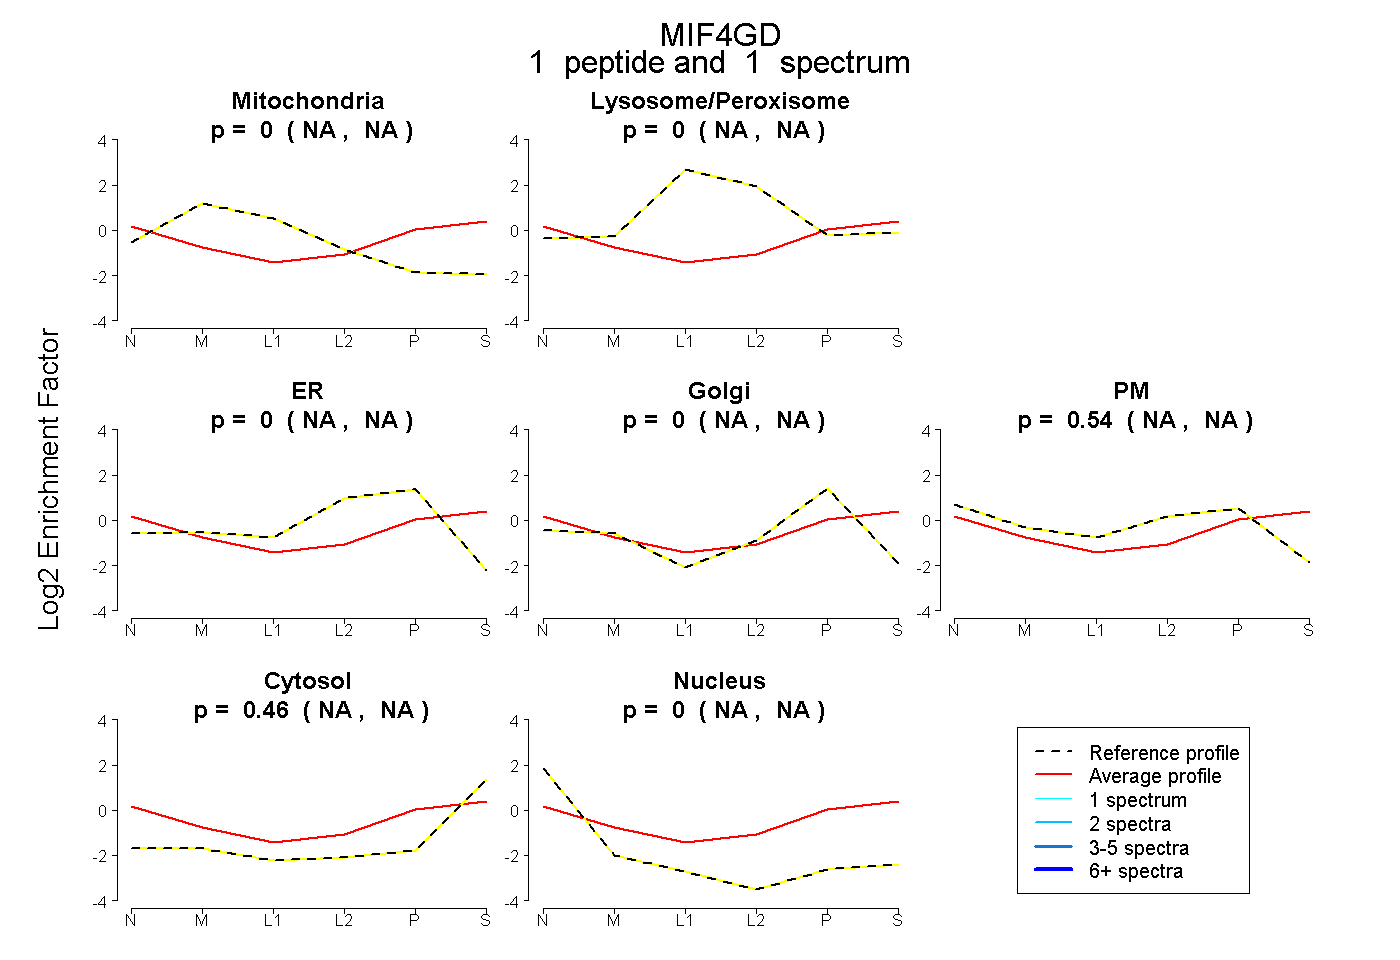 |
0.000 NA | NA |
0.001 NA | NA |
0.000 NA | NA |
0.000 NA | NA |
0.535 NA | NA |
0.463 NA | NA |
0.000 NA | NA |
|||
| Plot | Lyso | Other | |||||||||||
| Expt C |
2 peptides |
3 spectra |
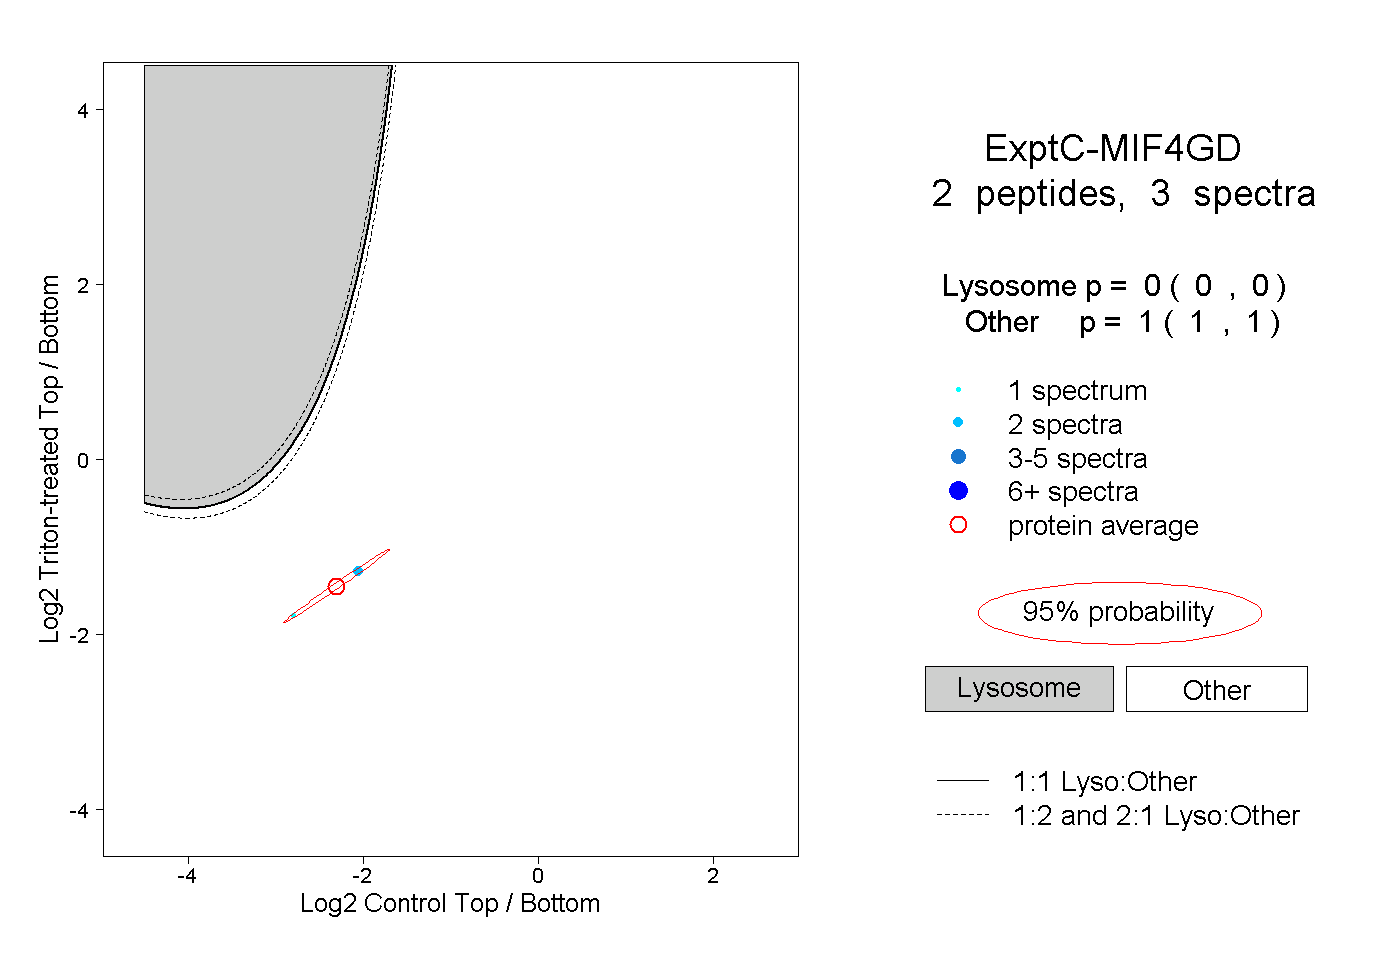 |
0.000 0.000 | 0.000 |
1.000 1.000 | 1.000 |
||||||||
| Plot | Lyso | Other | |||||||||||
| Expt D |
1 peptide |
1 spectrum |
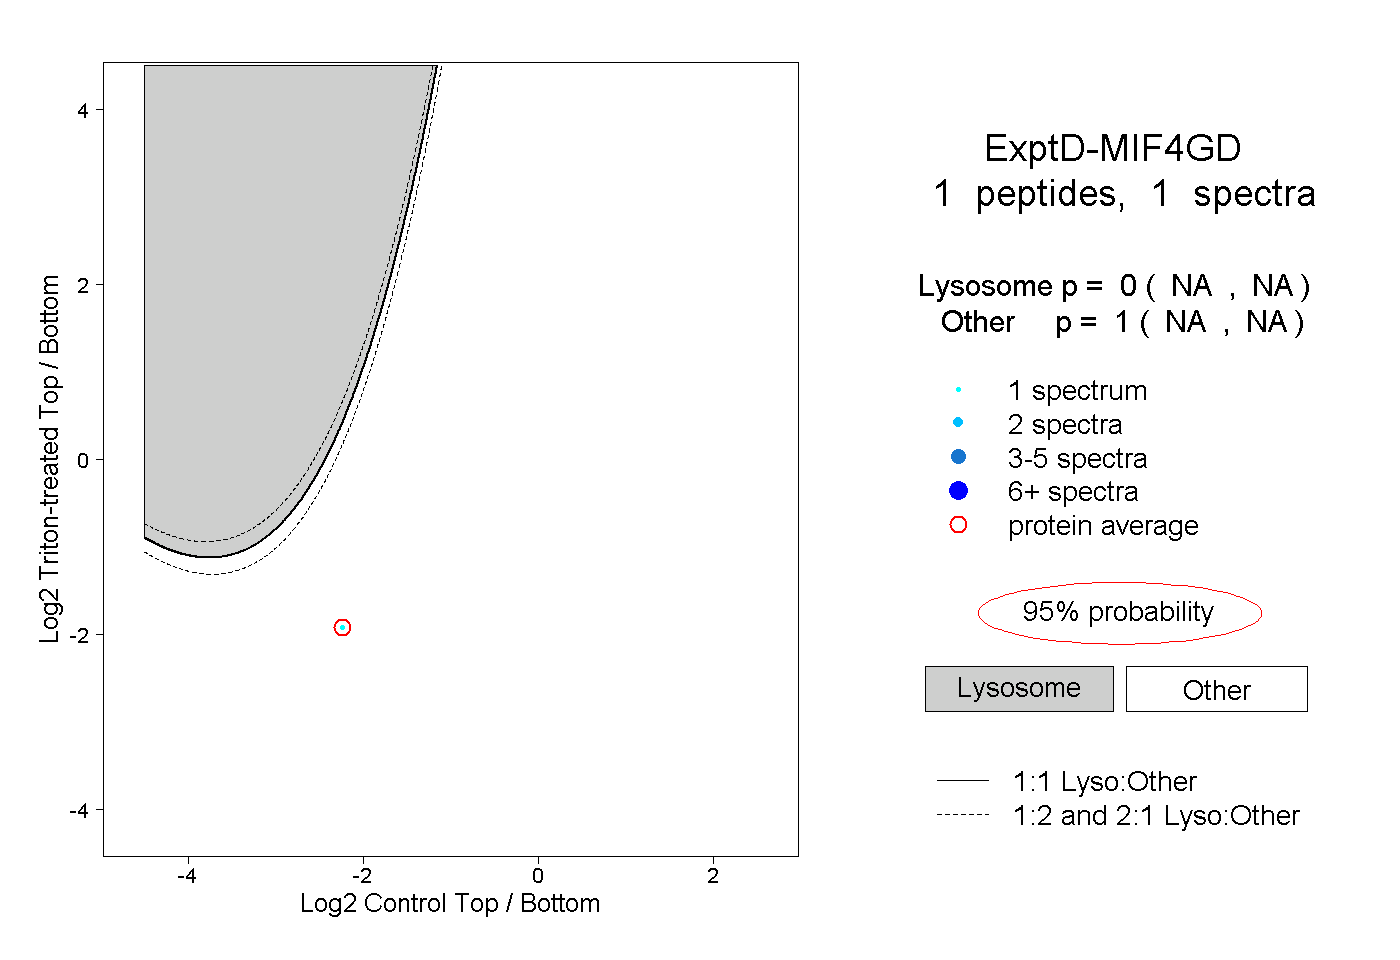 |
0.000 NA | NA |
1.000 NA | NA |