 1
1peptide
spectra
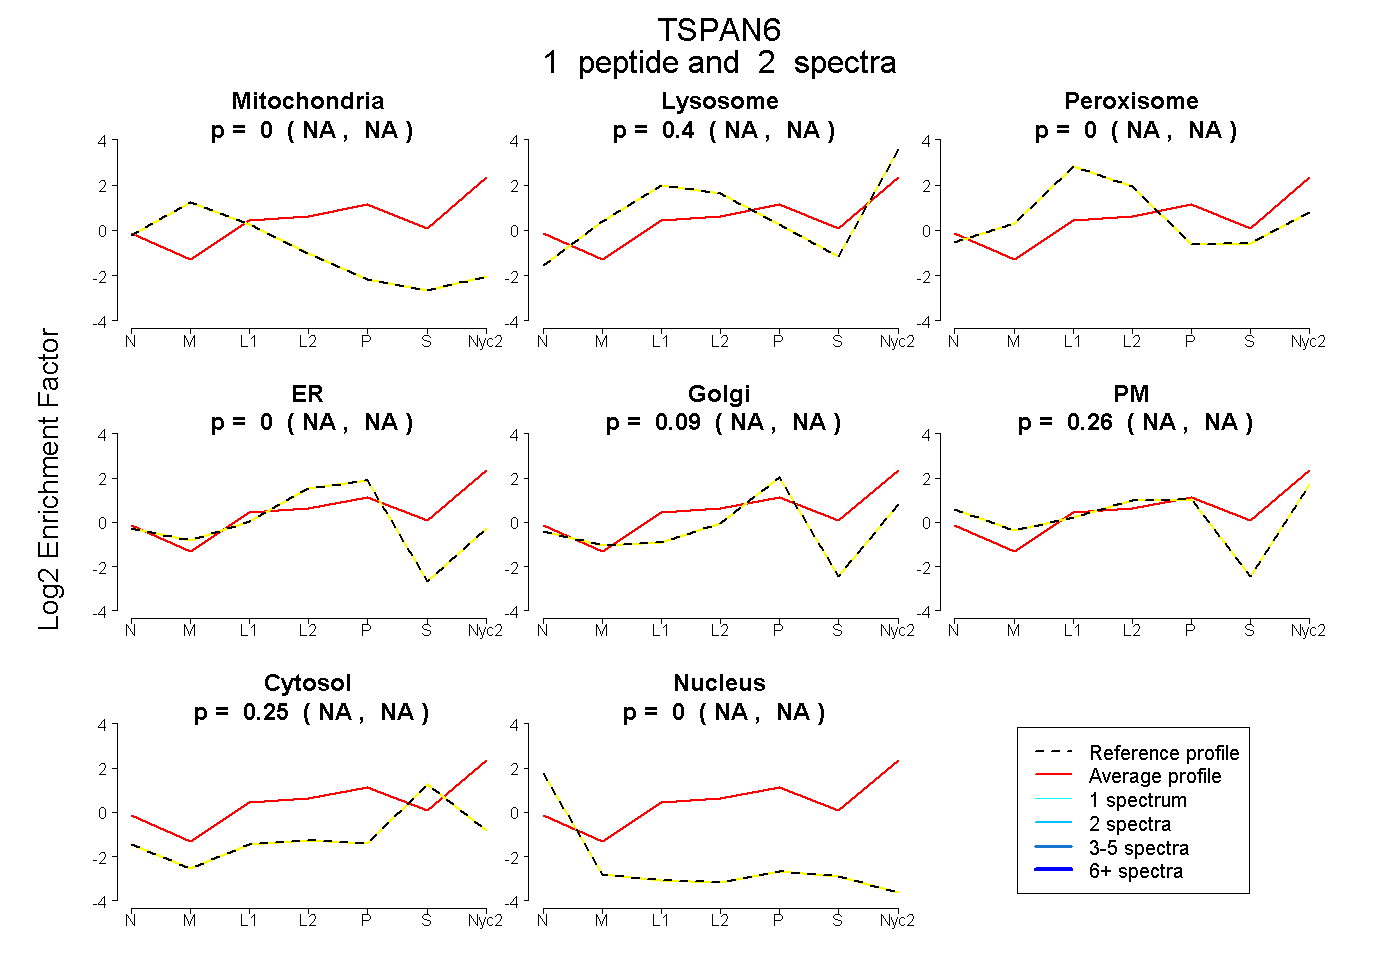
NA | NA
NA | NA
NA | NA
NA | NA
NA | NA
NA | NA
NA | NA
NA | NA
4peptides
spectra
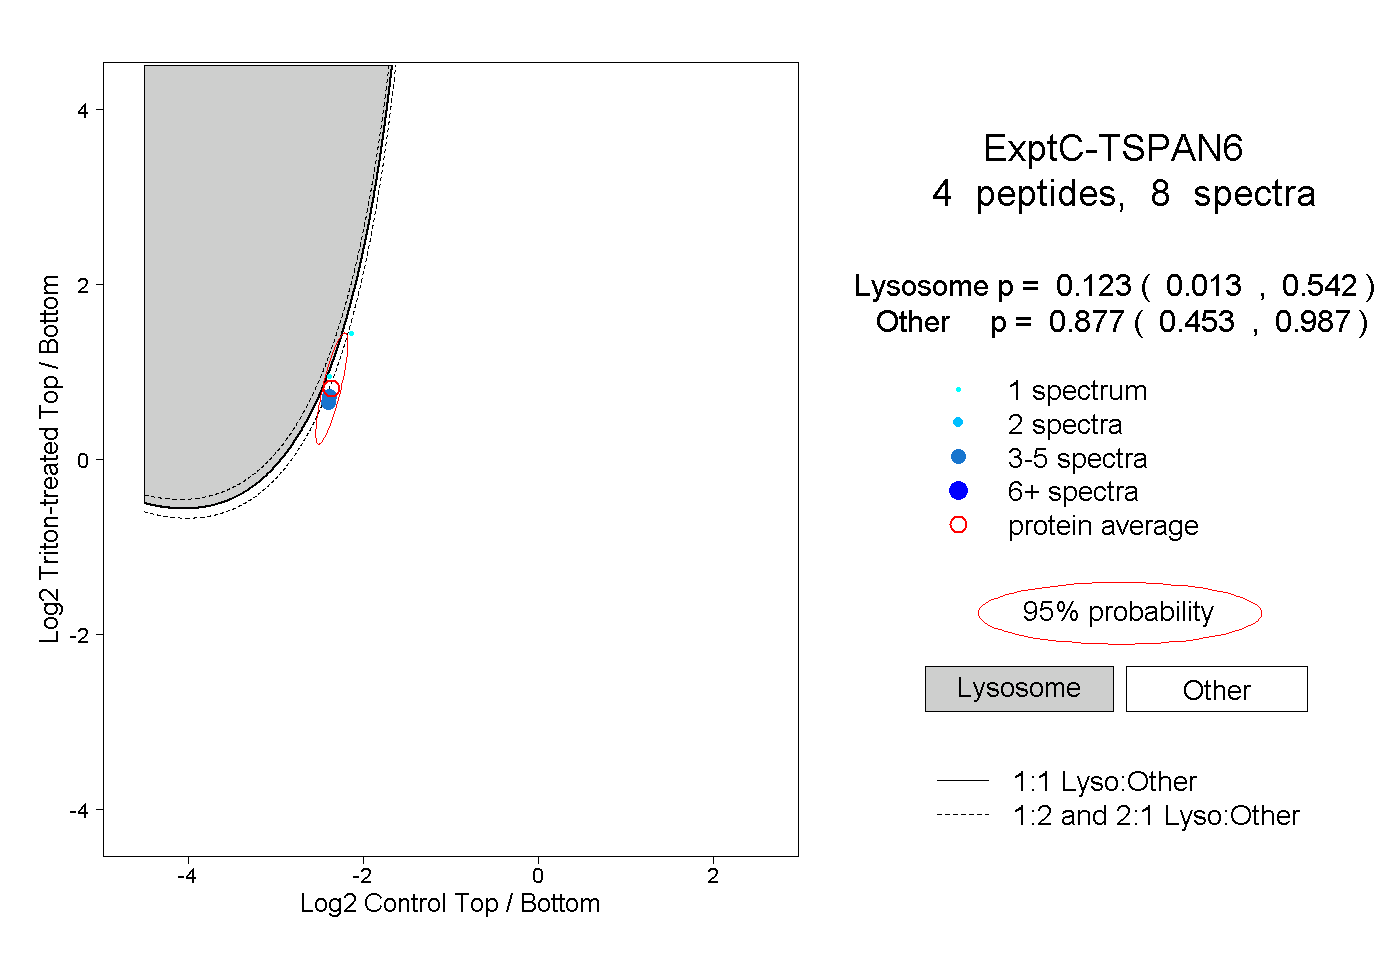
0.013 | 0.542
0.453 | 0.987
| Plot | Mito | Lyso | Perox | ER | Golgi | PM | Cytosol | Nucleus | |||||
| Expt A |
1 peptide |
2 spectra |
|
0.000 NA | NA |
0.397 NA | NA |
0.000 NA | NA |
0.000 NA | NA |
0.091 NA | NA |
0.262 NA | NA |
0.250 NA | NA |
0.000 NA | NA |
||
| Plot | Lyso | Other | |||||||||||
| Expt C |
4 peptides |
8 spectra |
|
0.123 0.013 | 0.542 |
0.877 0.453 | 0.987 |