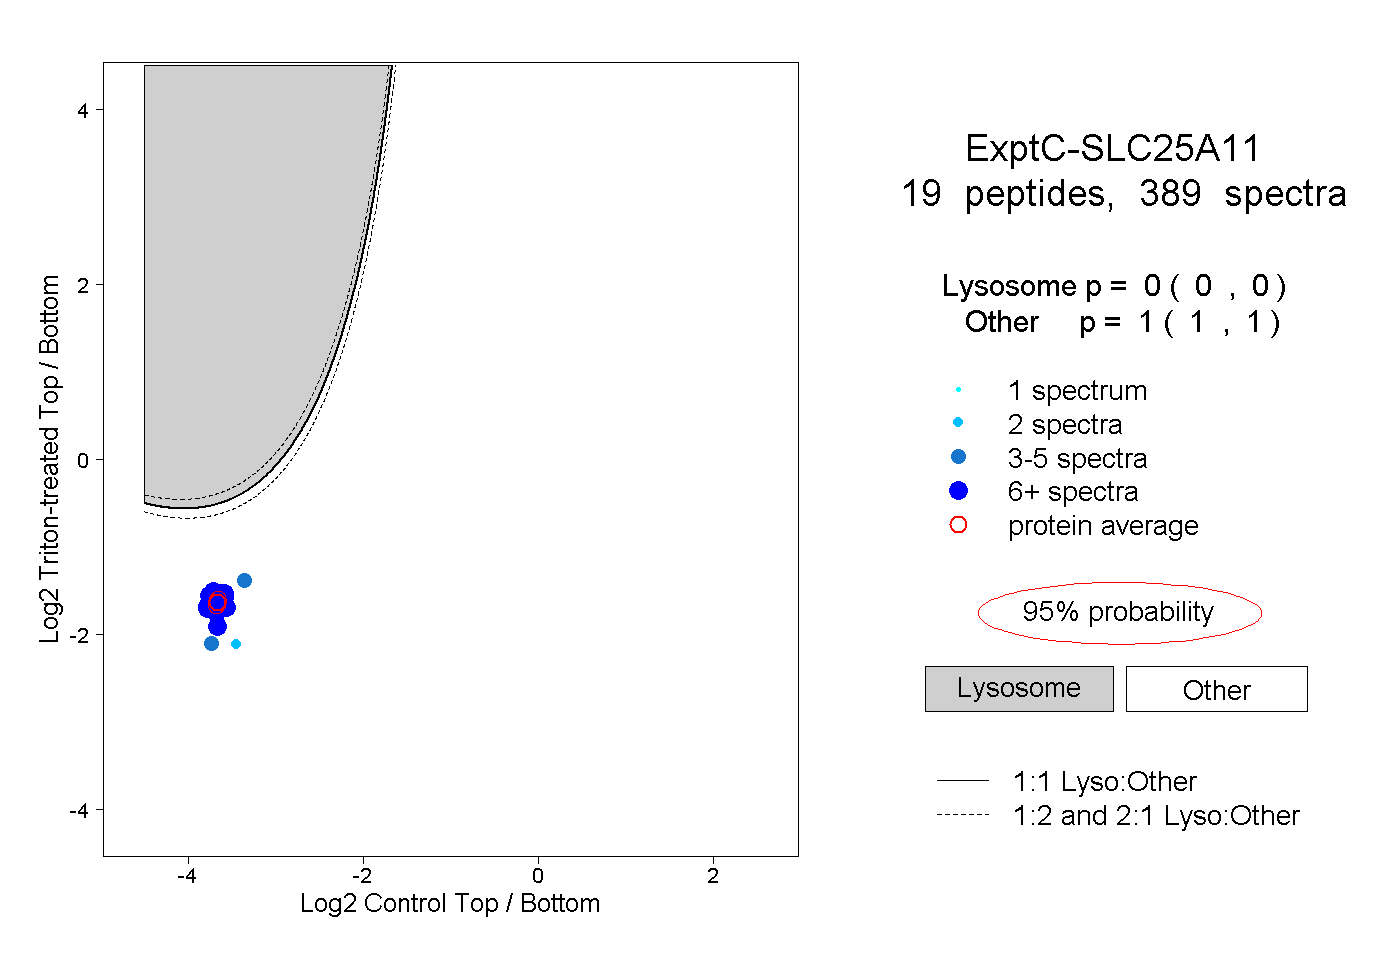
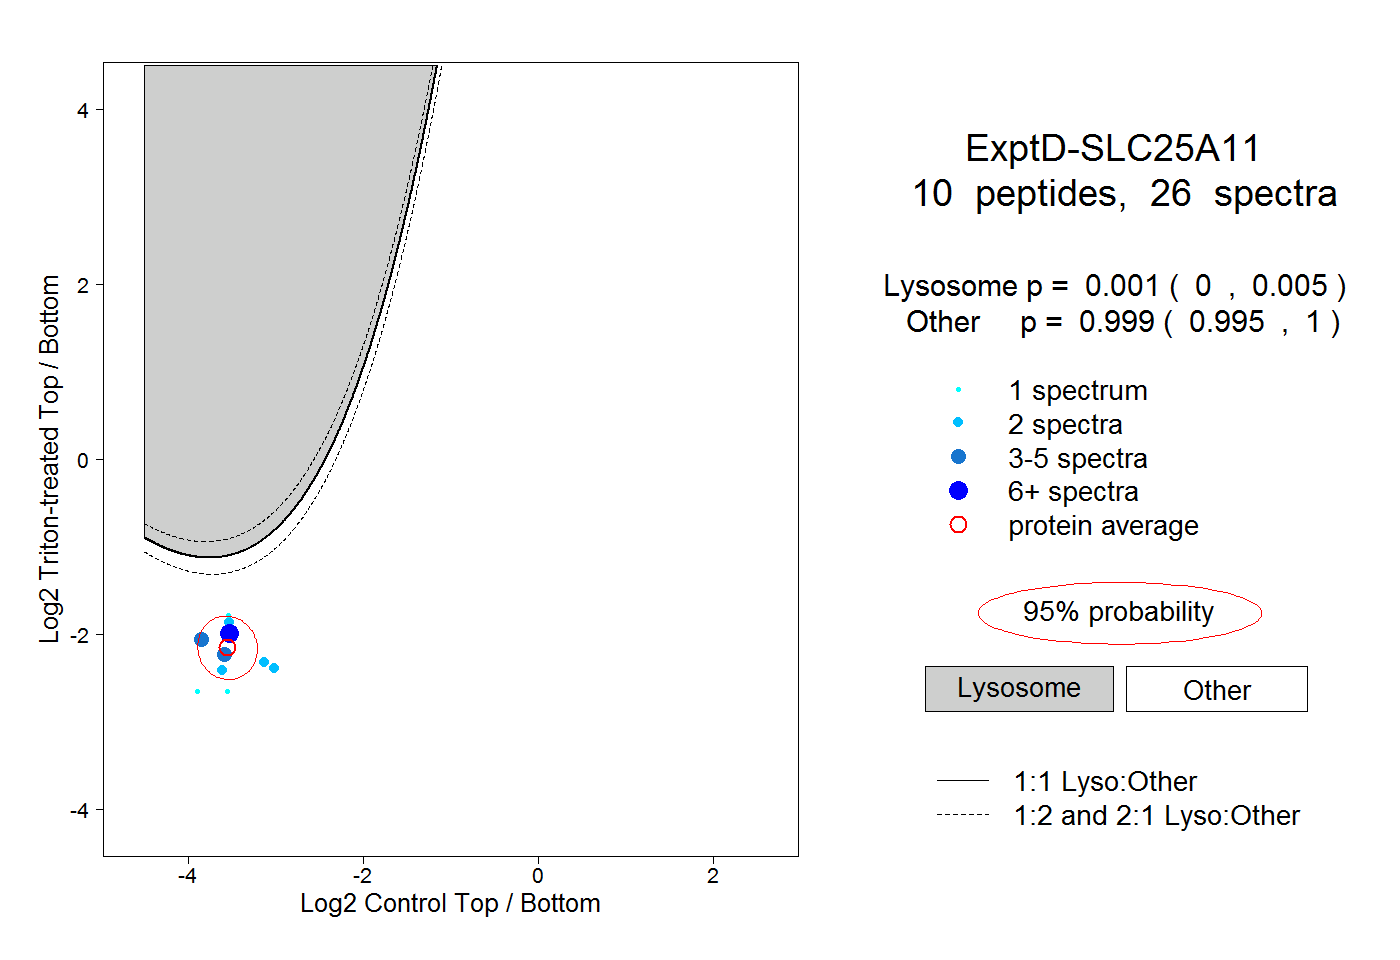
SLC25A11
[ENSRNOP00000005144]
Main page
| | | Plot |
Mito |
Lyso |
|
Perox |
ER |
Golgi |
PM |
Cytosol |
Nucleus |
|
| Expt A |
 17
17
peptides |
93
spectra |
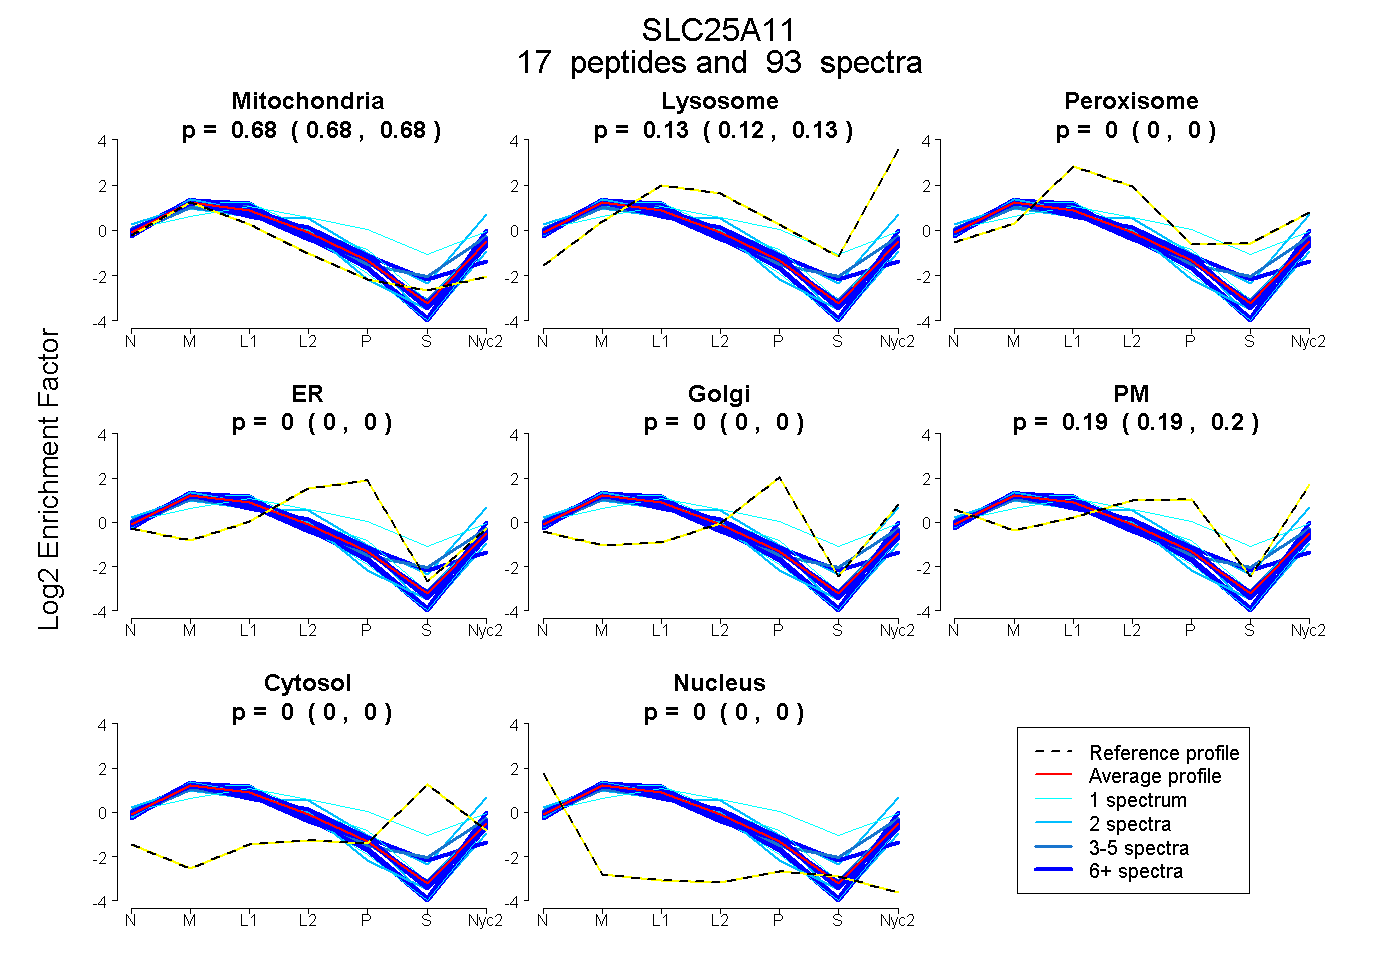 |
0.682
0.679 | 0.684 |
0.127
0.122 | 0.131 |
|
0.000
0.000 | 0.000 |
0.000
0.000 | 0.000 |
0.000
0.000 | 0.000 |
0.191
0.187 | 0.195 |
0.000
0.000 | 0.000 |
0.000
0.000 | 0.000 |
|
| | | Plot |
Mito |
|
Lyso or Perox |
|
ER |
Golgi |
PM |
Cytosol |
Nucleus |
|
| Expt B |
13
peptides |
56
spectra |
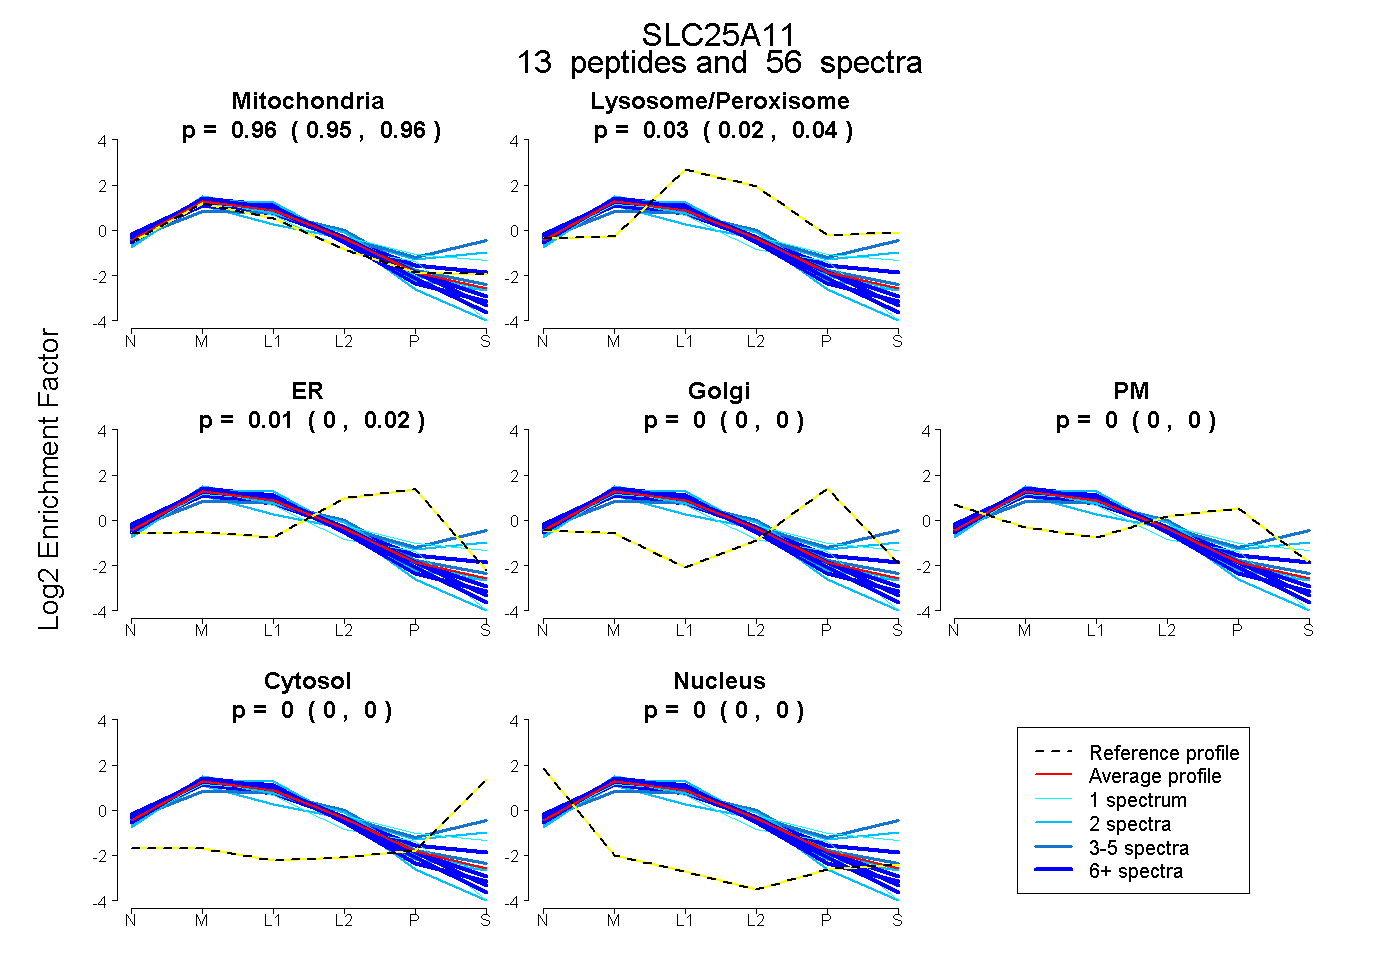 |
0.956
0.949 | 0.963 |
|
0.033
0.022 | 0.041 |
|
0.011
0.002 | 0.018 |
0.000
0.000 | 0.000 |
0.000
0.000 | 0.000 |
0.000
0.000 | 0.000 |
0.000
0.000 | 0.000 |
|
| | | Plot |
|
Lyso |
|
|
|
|
|
|
|
Other |
| Expt C |
19
peptides |
389
spectra |
 |
|
0.000
0.000 | 0.000 |
|
|
|
|
|
|
|
1.000
1.000 | 1.000 |
| | | Plot |
|
Lyso |
|
|
|
|
|
|
|
Other |
| Expt D |
10
peptides |
26
spectra |
 |
|
0.001
0.000 | 0.005 |
|
|
|
|
|
|
|
0.999
0.995 | 1.000 |
| 2 spectra, EEGVPTLWR |
|
0.005 |
|
|
|
|
|
|
|
0.995 |
| 2 spectra, GCIPTMAR |
|
0.000 |
|
|
|
|
|
|
|
1.000 |
| 2 spectra, MDGKPR |
|
0.000 |
|
|
|
|
|
|
|
1.000 |
| 1 spectrum, GIYTGLSAGLLR |
|
0.000 |
|
|
|
|
|
|
|
1.000 |
| 5 spectra, QATYTTTR |
|
0.001 |
|
|
|
|
|
|
|
0.999 |
| 2 spectra, GFTPYYAR |
|
0.000 |
|
|
|
|
|
|
|
1.000 |
| 1 spectrum, LPADQR |
|
0.000 |
|
|
|
|
|
|
|
1.000 |
| 3 spectra, MQLSGEGAK |
|
0.000 |
|
|
|
|
|
|
|
1.000 |
| 1 spectrum, YEGFFSLWK |
|
0.008 |
|
|
|
|
|
|
|
0.992 |
| 7 spectra, NGLDVLLK |
|
0.002 |
|
|
|
|
|
|
|
0.998 |