13
13peptides
spectra
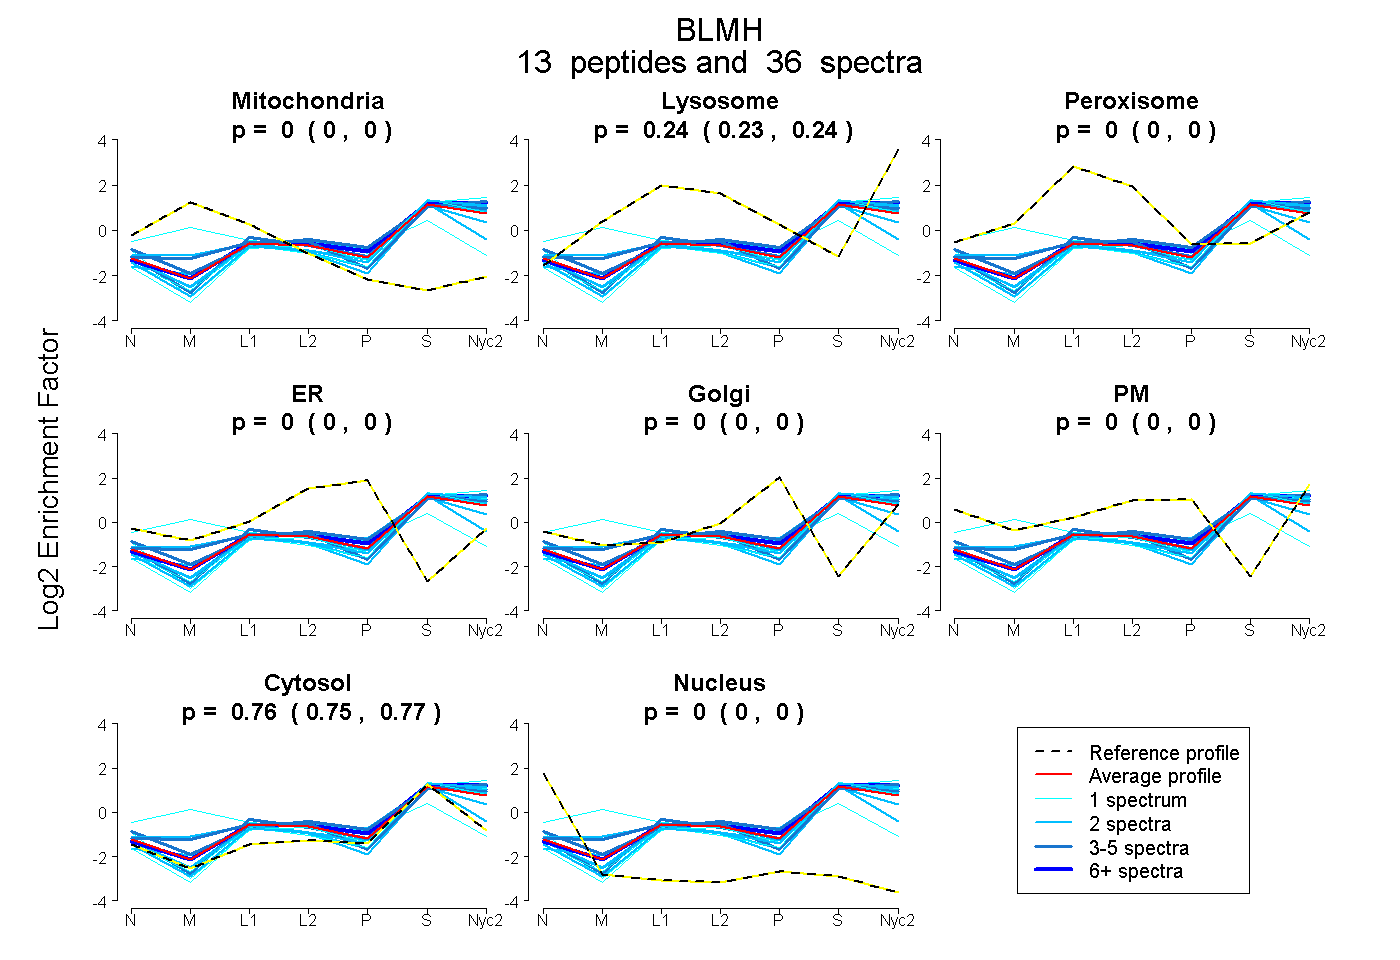
0.000 | 0.000
0.234 | 0.245
0.000 | 0.000
0.000 | 0.000
0.000 | 0.000
0.000 | 0.000
0.754 | 0.765
0.000 | 0.000
5peptides
spectra
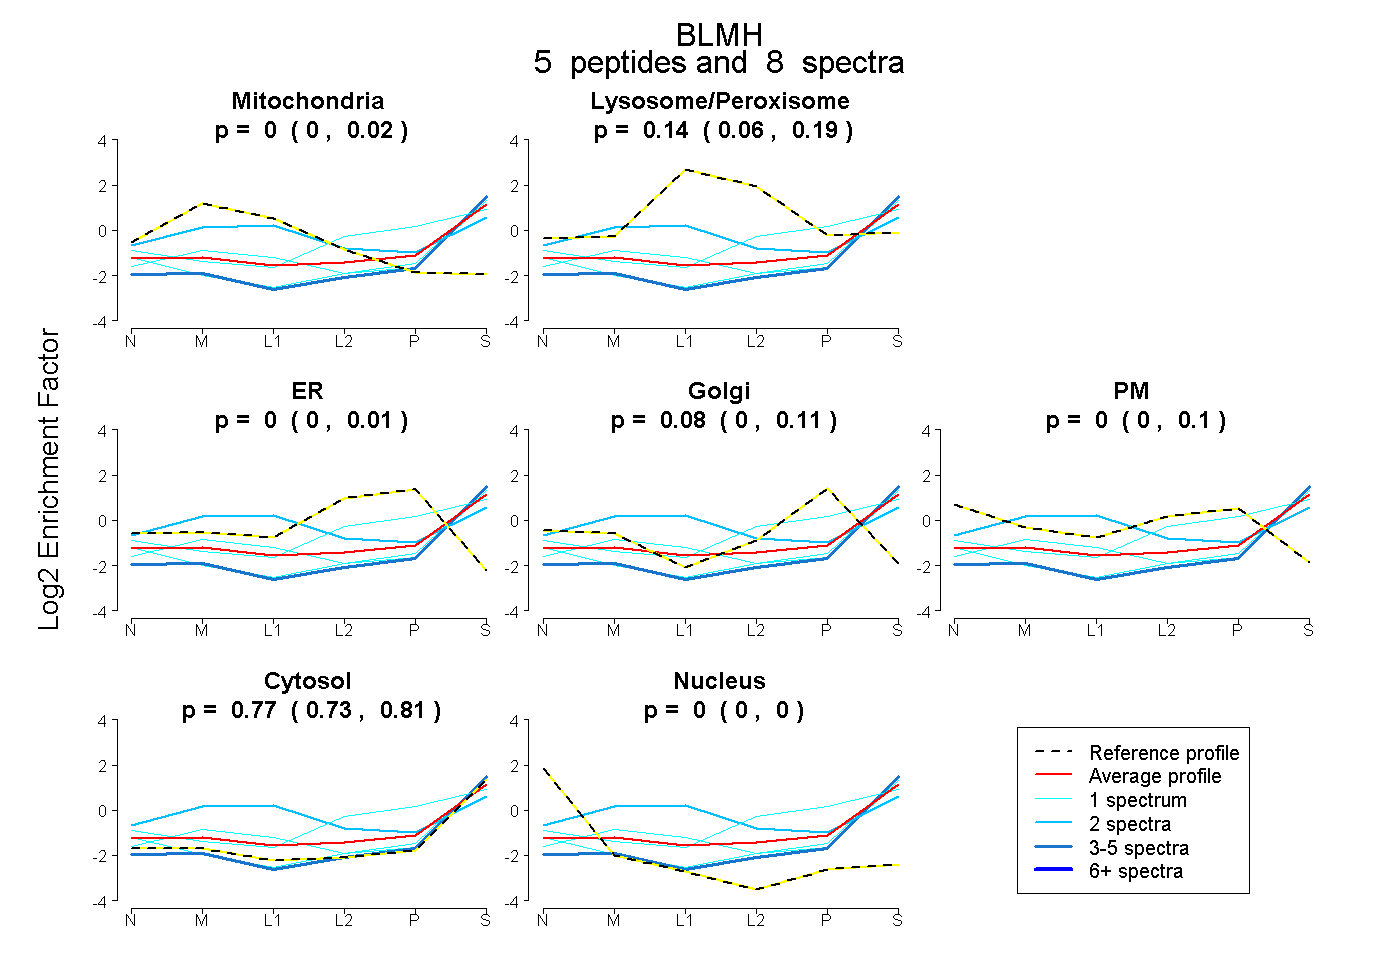
0.000 | 0.023
0.062 | 0.186
0.000 | 0.009
0.000 | 0.115
0.000 | 0.096
0.732 | 0.812
0.000 | 0.000