 13
13peptides
spectra
0.000 | 0.000
0.234 | 0.245
0.000 | 0.000
0.000 | 0.000
0.000 | 0.000
0.000 | 0.000
0.754 | 0.765
0.000 | 0.000
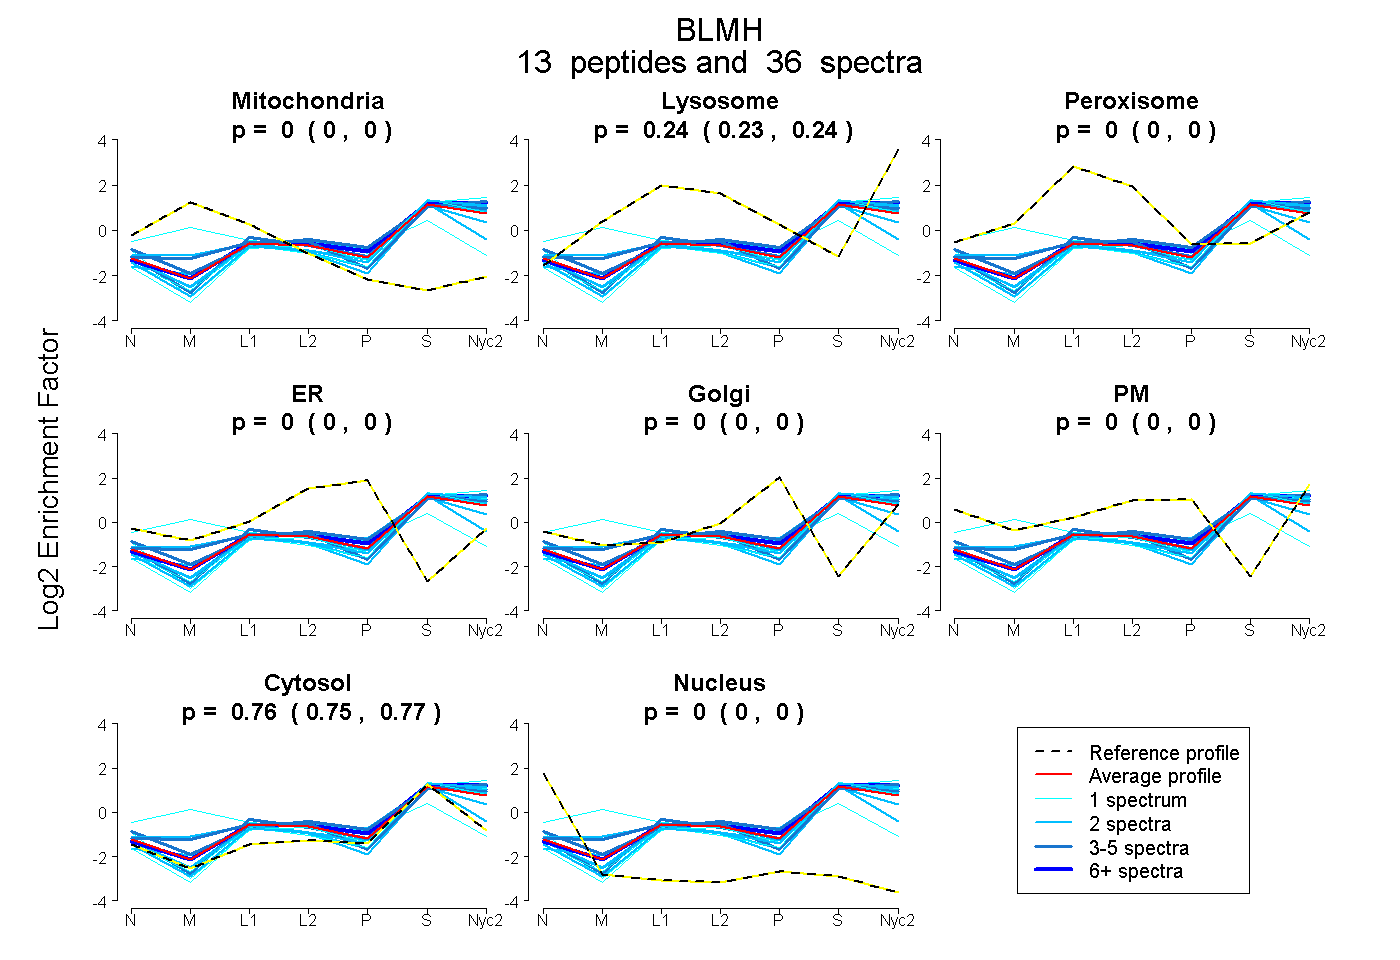
| Plot | Mito | Lyso | Perox | ER | Golgi | PM | Cytosol | Nucleus | |||||
| Expt A |
13 peptides |
36 spectra |
|
0.000 0.000 | 0.000 |
0.240 0.234 | 0.245 |
0.000 0.000 | 0.000 |
0.000 0.000 | 0.000 |
0.000 0.000 | 0.000 |
0.000 0.000 | 0.000 |
0.760 0.754 | 0.765 |
0.000 0.000 | 0.000 |
| 4 spectra, NLVHSGATK | 0.000 | 0.271 | 0.000 | 0.000 | 0.000 | 0.022 | 0.707 | 0.000 | ||
| 2 spectra, MNDILNHK | 0.000 | 0.233 | 0.000 | 0.000 | 0.000 | 0.000 | 0.767 | 0.000 | ||
| 2 spectra, YGVVPK | 0.000 | 0.189 | 0.000 | 0.000 | 0.000 | 0.000 | 0.811 | 0.000 | ||
| 1 spectrum, VENSWGEDHGHK | 0.000 | 0.159 | 0.000 | 0.000 | 0.000 | 0.000 | 0.841 | 0.000 | ||
| 3 spectra, VAAILGAK | 0.000 | 0.324 | 0.000 | 0.000 | 0.000 | 0.000 | 0.676 | 0.000 | ||
| 11 spectra, MVAASIR | 0.000 | 0.286 | 0.000 | 0.000 | 0.000 | 0.000 | 0.714 | 0.000 | ||
| 2 spectra, DGEAVWFGCDVGK | 0.000 | 0.016 | 0.124 | 0.000 | 0.000 | 0.000 | 0.860 | 0.000 | ||
| 1 spectrum, CYFFLNAFVDTAQK | 0.313 | 0.000 | 0.179 | 0.000 | 0.035 | 0.000 | 0.473 | 0.000 | ||
| 1 spectrum, VGPITPLQFYK | 0.000 | 0.192 | 0.000 | 0.000 | 0.000 | 0.000 | 0.808 | 0.000 | ||
| 4 spectra, GEISSTQDAMMEEIFR | 0.000 | 0.238 | 0.000 | 0.000 | 0.000 | 0.000 | 0.762 | 0.000 | ||
| 2 spectra, ICFVNDPRPQHK | 0.000 | 0.204 | 0.000 | 0.000 | 0.000 | 0.000 | 0.796 | 0.000 | ||
| 1 spectrum, EHVKPLFNMEDK | 0.000 | 0.249 | 0.000 | 0.000 | 0.000 | 0.000 | 0.751 | 0.000 | ||
| 2 spectra, TLYNNQPIDFLK | 0.034 | 0.248 | 0.000 | 0.000 | 0.000 | 0.000 | 0.718 | 0.000 |
| Plot | Mito | Lyso or Perox | ER | Golgi | PM | Cytosol | Nucleus | ||||||
| Expt B |
5 peptides |
8 spectra |
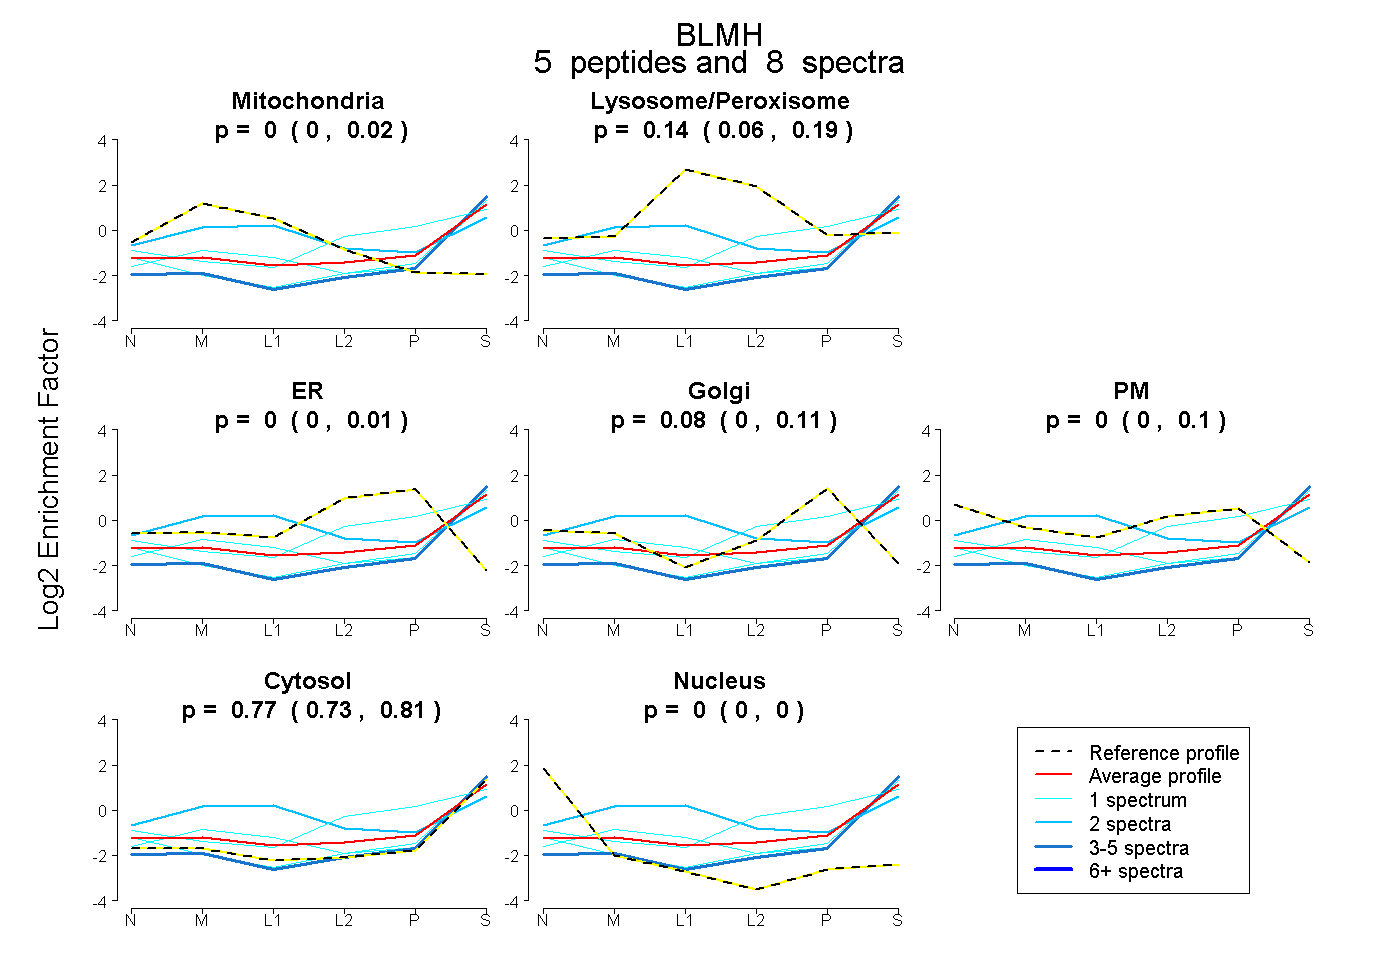 |
0.000 0.000 | 0.023 |
0.144 0.062 | 0.186 |
0.000 0.000 | 0.009 |
0.079 0.000 | 0.115 |
0.003 0.000 | 0.096 |
0.774 0.732 | 0.812 |
0.000 0.000 | 0.000 |
|||
| Plot | Lyso | Other | |||||||||||
| Expt C |
10 peptides |
35 spectra |
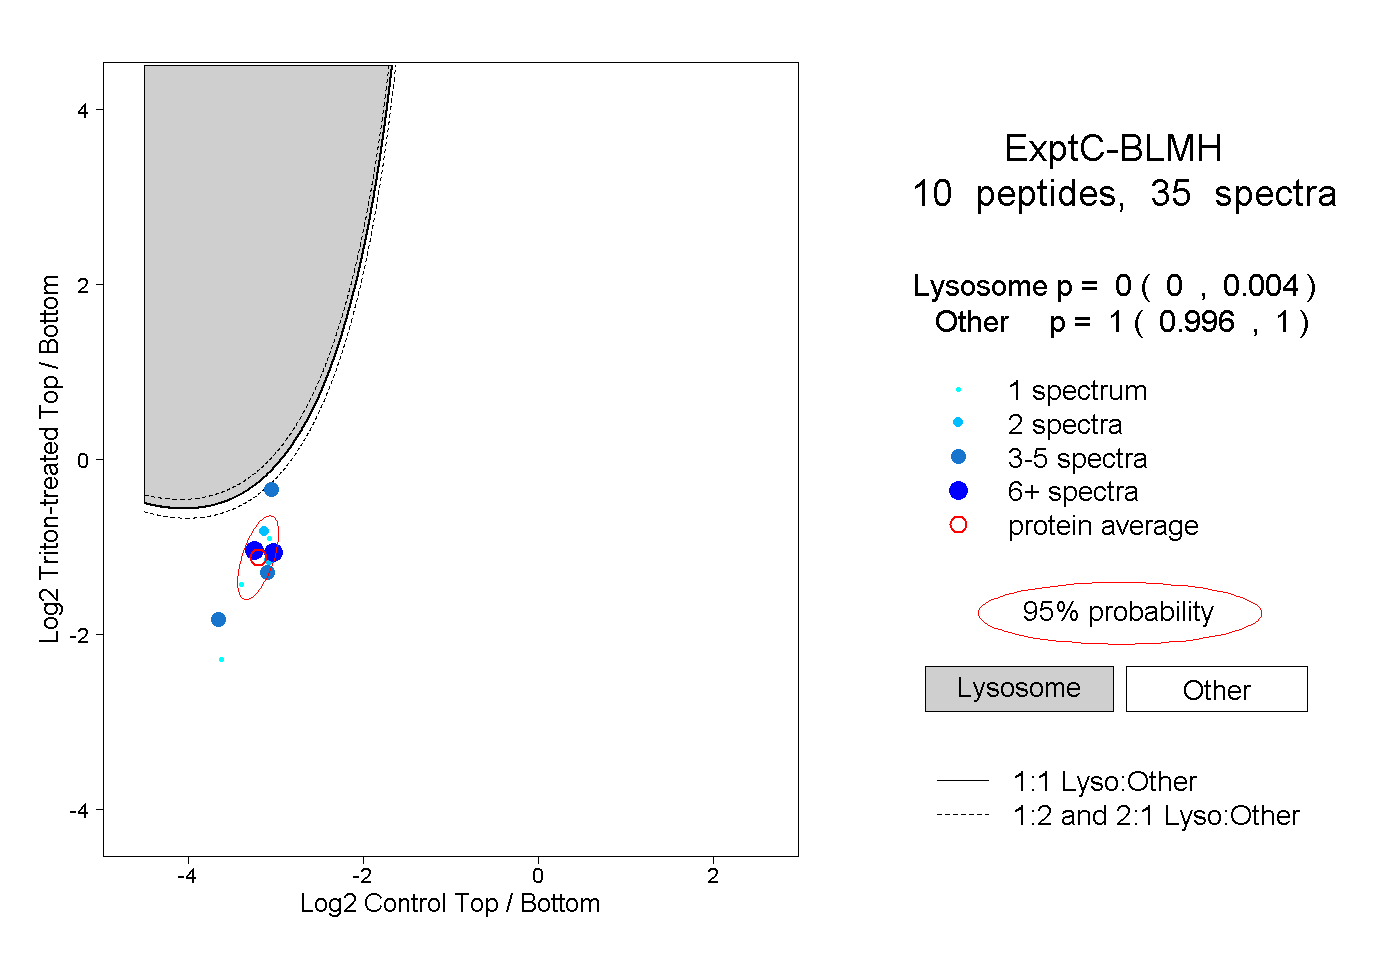 |
0.000 0.000 | 0.004 |
1.000 0.996 | 1.000 |
||||||||
| Plot | Lyso | Other | |||||||||||
| Expt D |
2 peptides |
3 spectra |
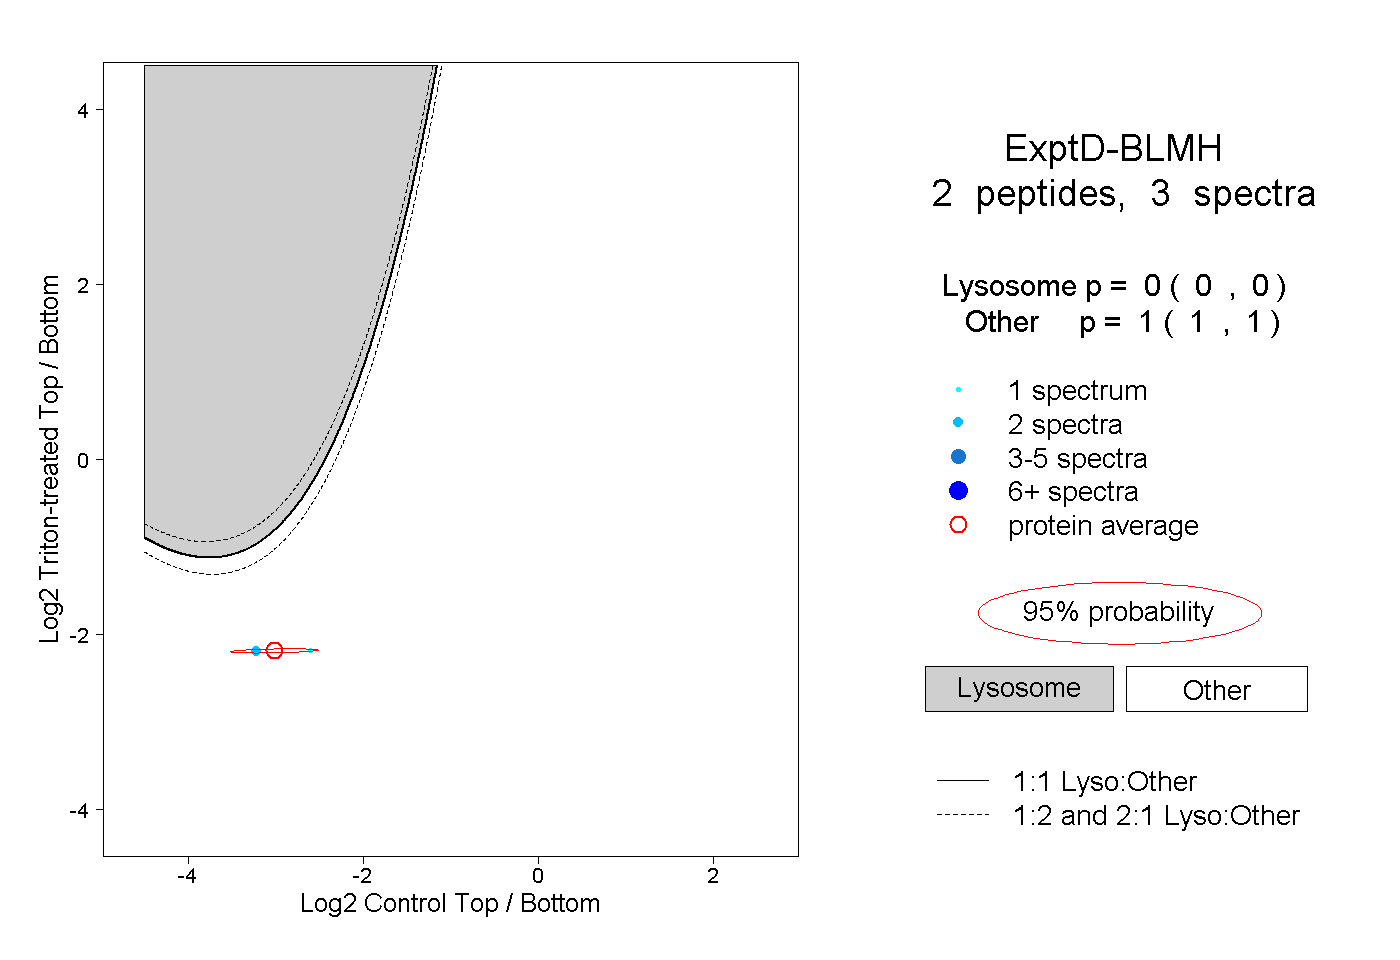 |
0.000 0.000 | 0.000 |
1.000 1.000 | 1.000 |