 4
4peptides
spectra
0.797 | 0.843
0.000 | 0.000
0.000 | 0.053
0.085 | 0.116
0.000 | 0.000
0.000 | 0.000
0.032 | 0.058
0.000 | 0.000
| Plot | Mito | Lyso | Perox | ER | Golgi | PM | Cytosol | Nucleus | |||||
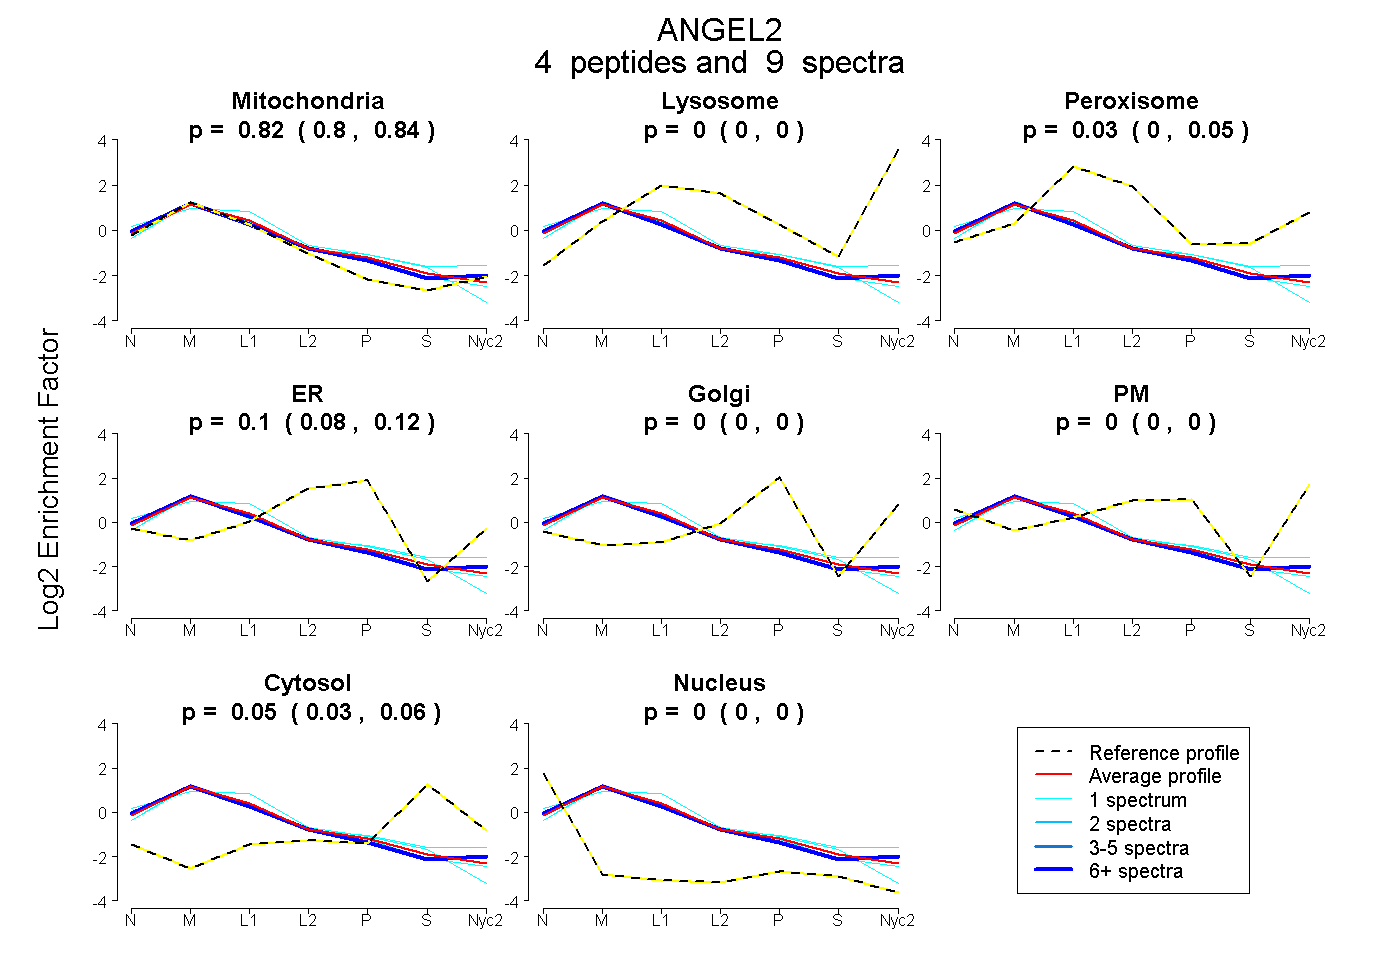
| Expt A |
4 peptides |
9 spectra |
|
0.822 0.797 | 0.843 |
0.000 0.000 | 0.000 |
0.029 0.000 | 0.053 |
0.103 0.085 | 0.116 |
0.000 0.000 | 0.000 |
0.000 0.000 | 0.000 |
0.047 0.032 | 0.058 |
0.000 0.000 | 0.000 |
| 1 spectrum, DIPLLDR | 0.712 | 0.000 | 0.098 | 0.000 | 0.103 | 0.000 | 0.086 | 0.000 | ||
| 1 spectrum, AASPSICIANTHLLYNPR | 0.804 | 0.000 | 0.072 | 0.071 | 0.000 | 0.000 | 0.015 | 0.038 | ||
| 6 spectra, VSGQEQSSR | 0.839 | 0.000 | 0.018 | 0.115 | 0.000 | 0.000 | 0.027 | 0.000 | ||
| 1 spectrum, FSLLSVNPVEFCR | 0.865 | 0.000 | 0.000 | 0.110 | 0.000 | 0.000 | 0.025 | 0.000 |
| Plot | Mito | Lyso or Perox | ER | Golgi | PM | Cytosol | Nucleus | ||||||
| Expt B |
1 peptide |
1 spectrum |
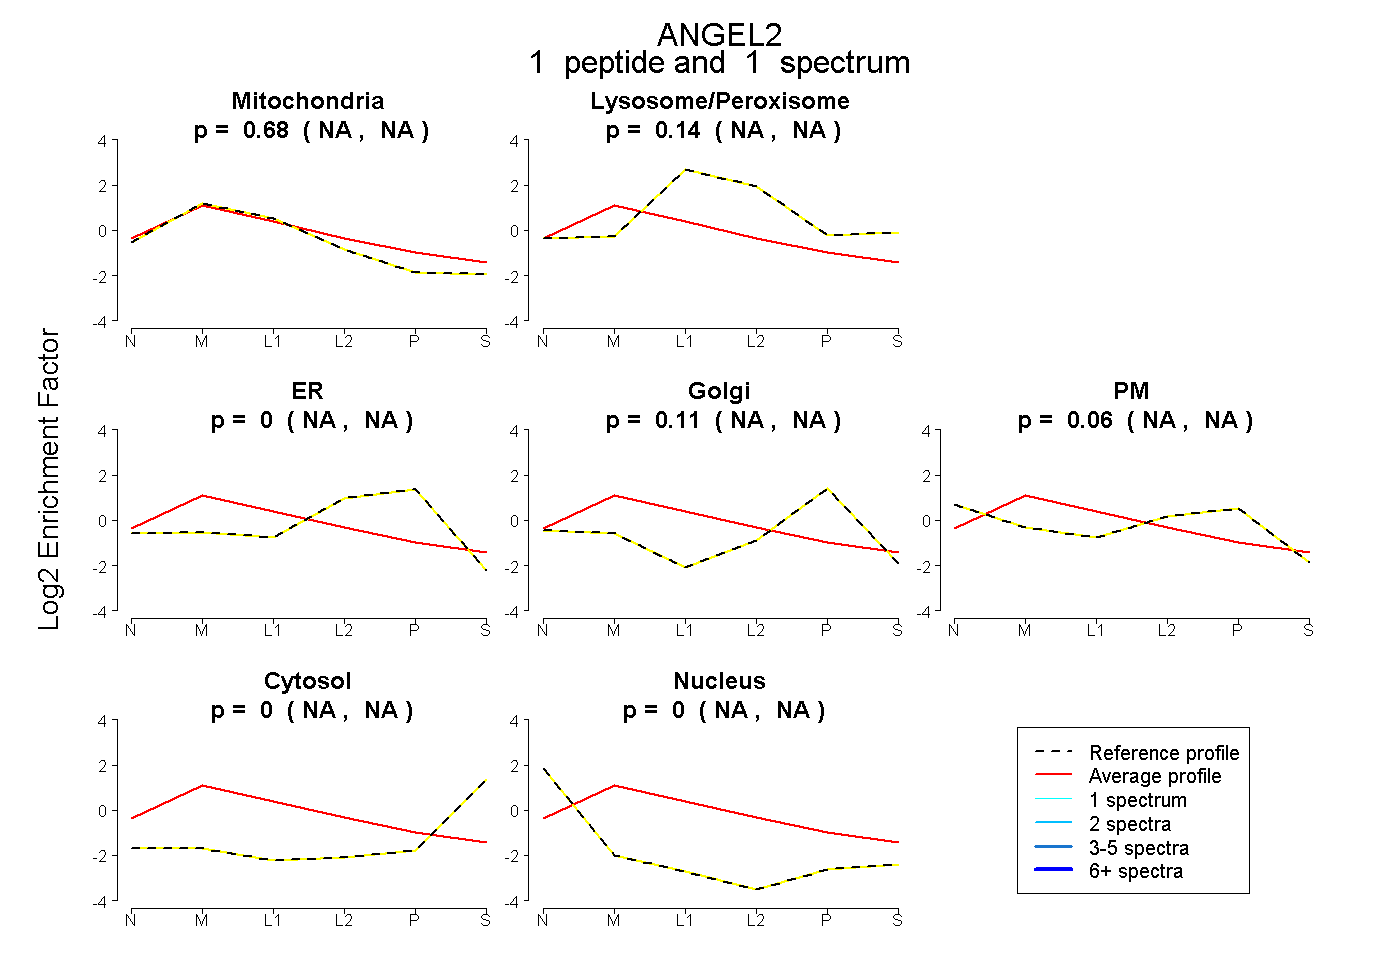 |
0.682 NA | NA |
0.143 NA | NA |
0.000 NA | NA |
0.113 NA | NA |
0.062 NA | NA |
0.000 NA | NA |
0.000 NA | NA |
|||
| Plot | Lyso | Other | |||||||||||
| Expt C |
6 peptides |
18 spectra |
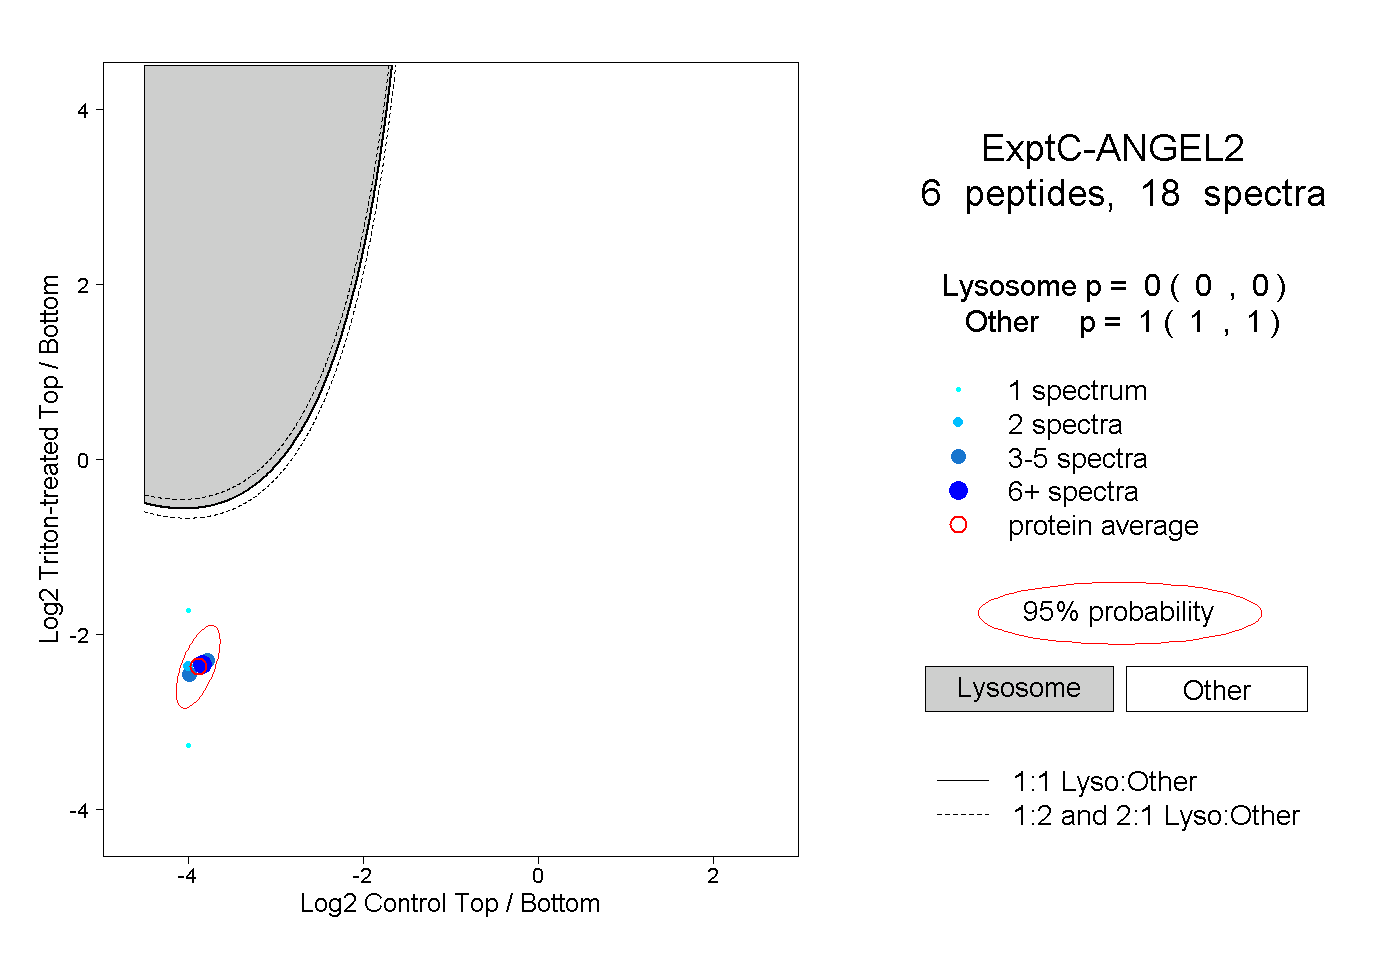 |
0.000 0.000 | 0.000 |
1.000 1.000 | 1.000 |
||||||||
| Plot | Lyso | Other | |||||||||||
| Expt D |
1 peptide |
1 spectrum |
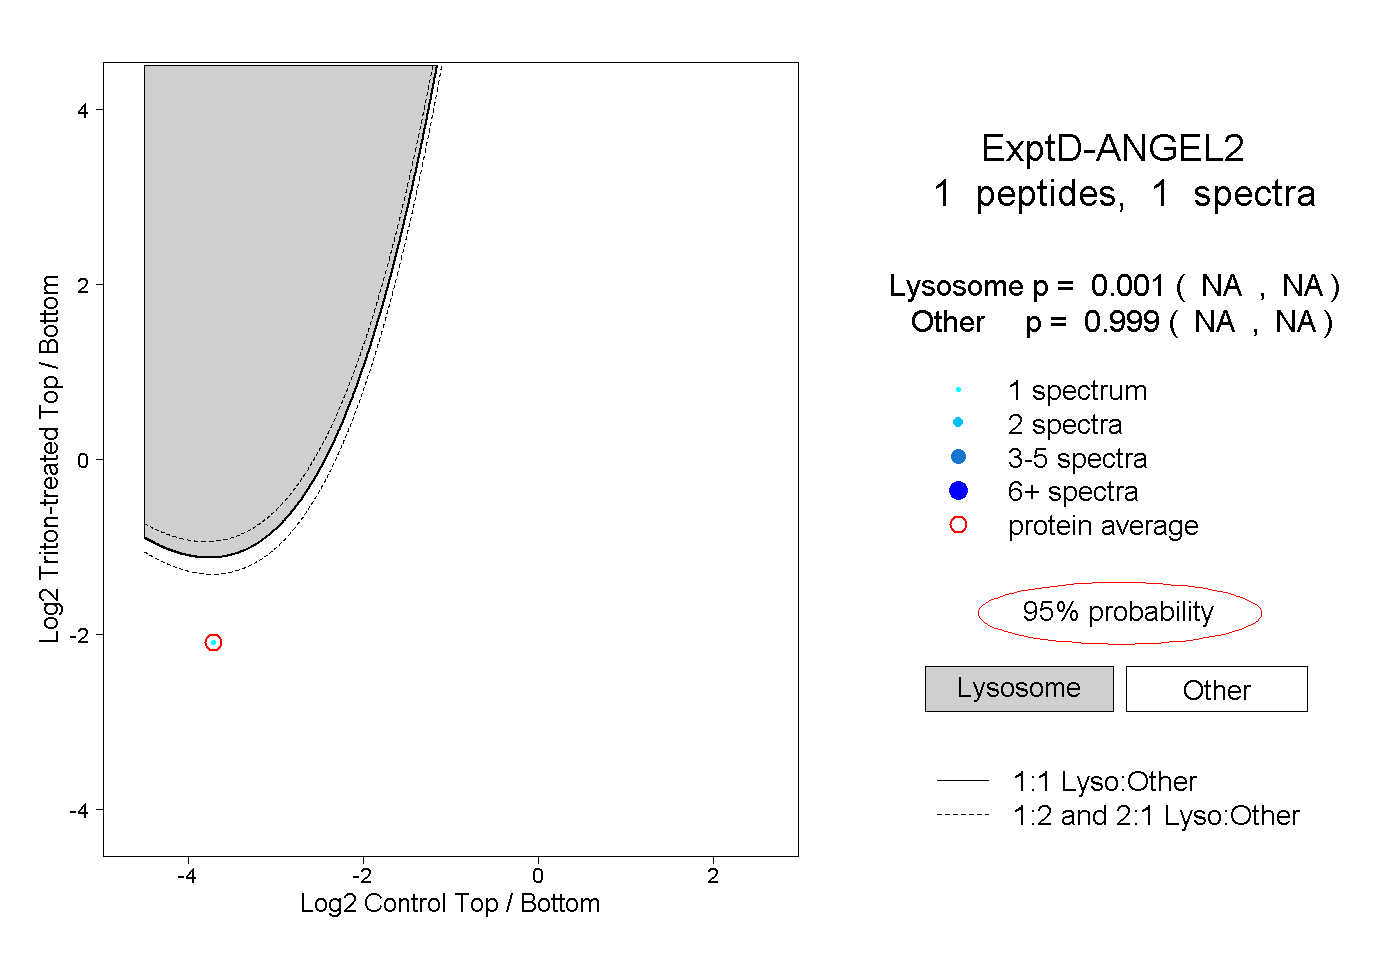 |
0.001 NA | NA |
0.999 NA | NA |