 8
8peptides
spectra
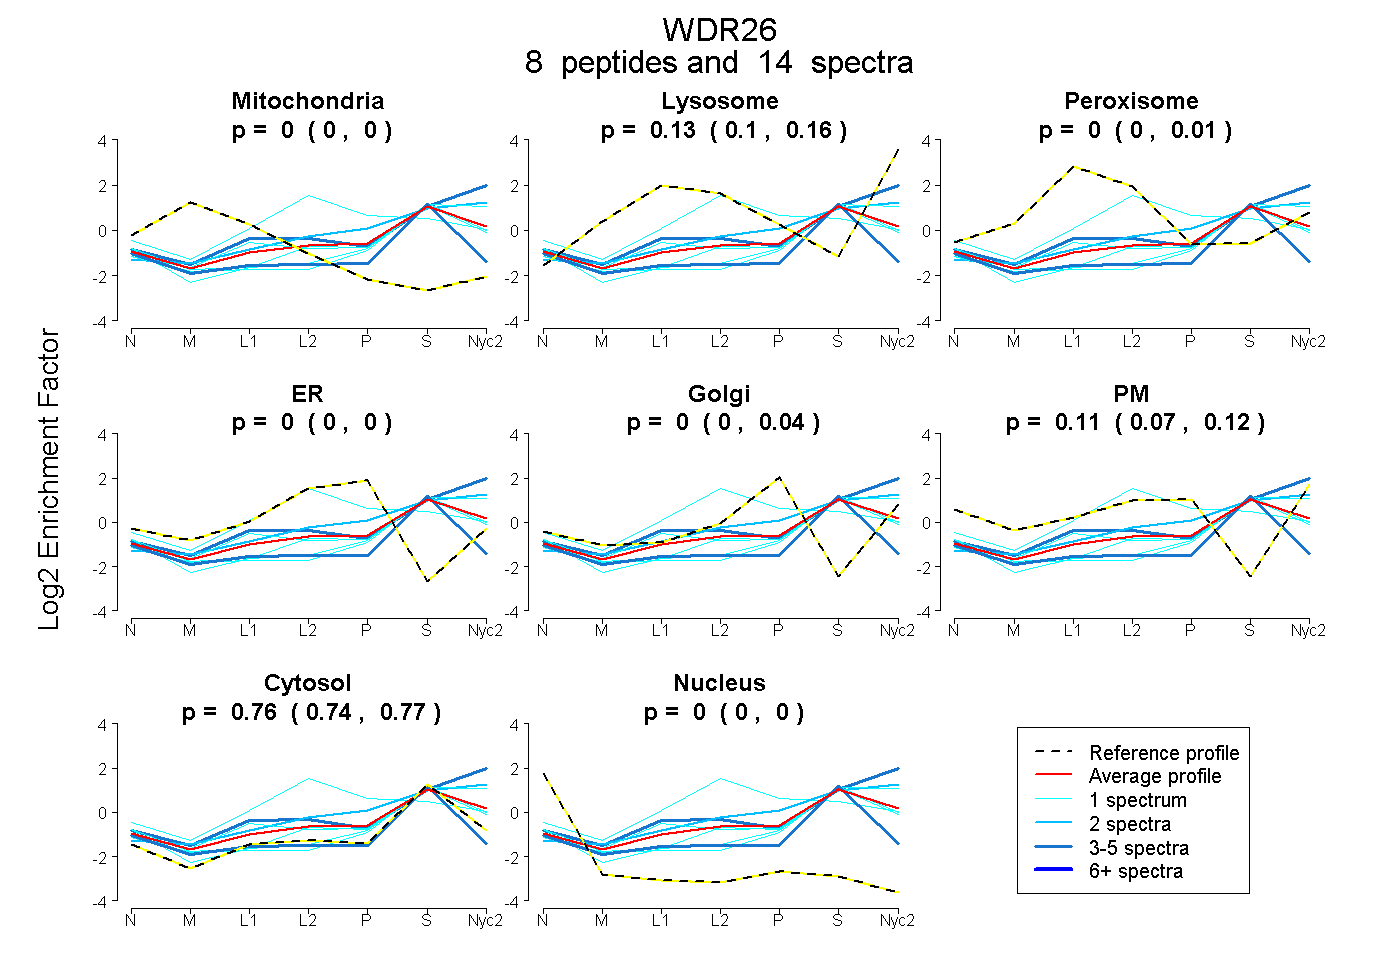
0.000 | 0.000
0.096 | 0.164
0.000 | 0.010
0.000 | 0.000
0.000 | 0.037
0.069 | 0.125
0.736 | 0.771
0.000 | 0.000
1peptide
spectrum
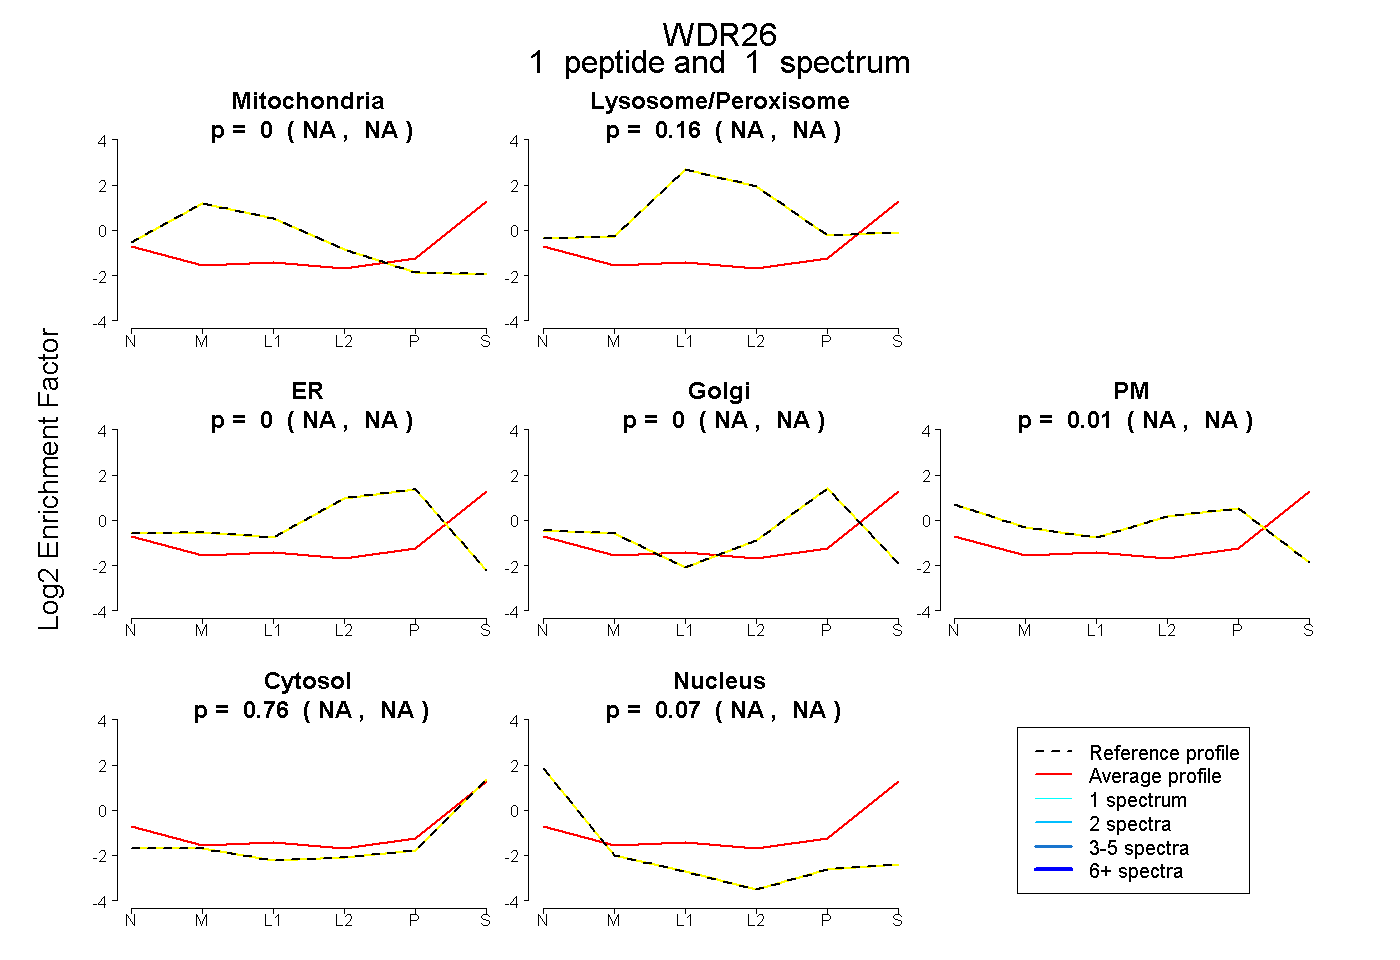
NA | NA
NA | NA
NA | NA
NA | NA
NA | NA
NA | NA
NA | NA
6peptides
spectra
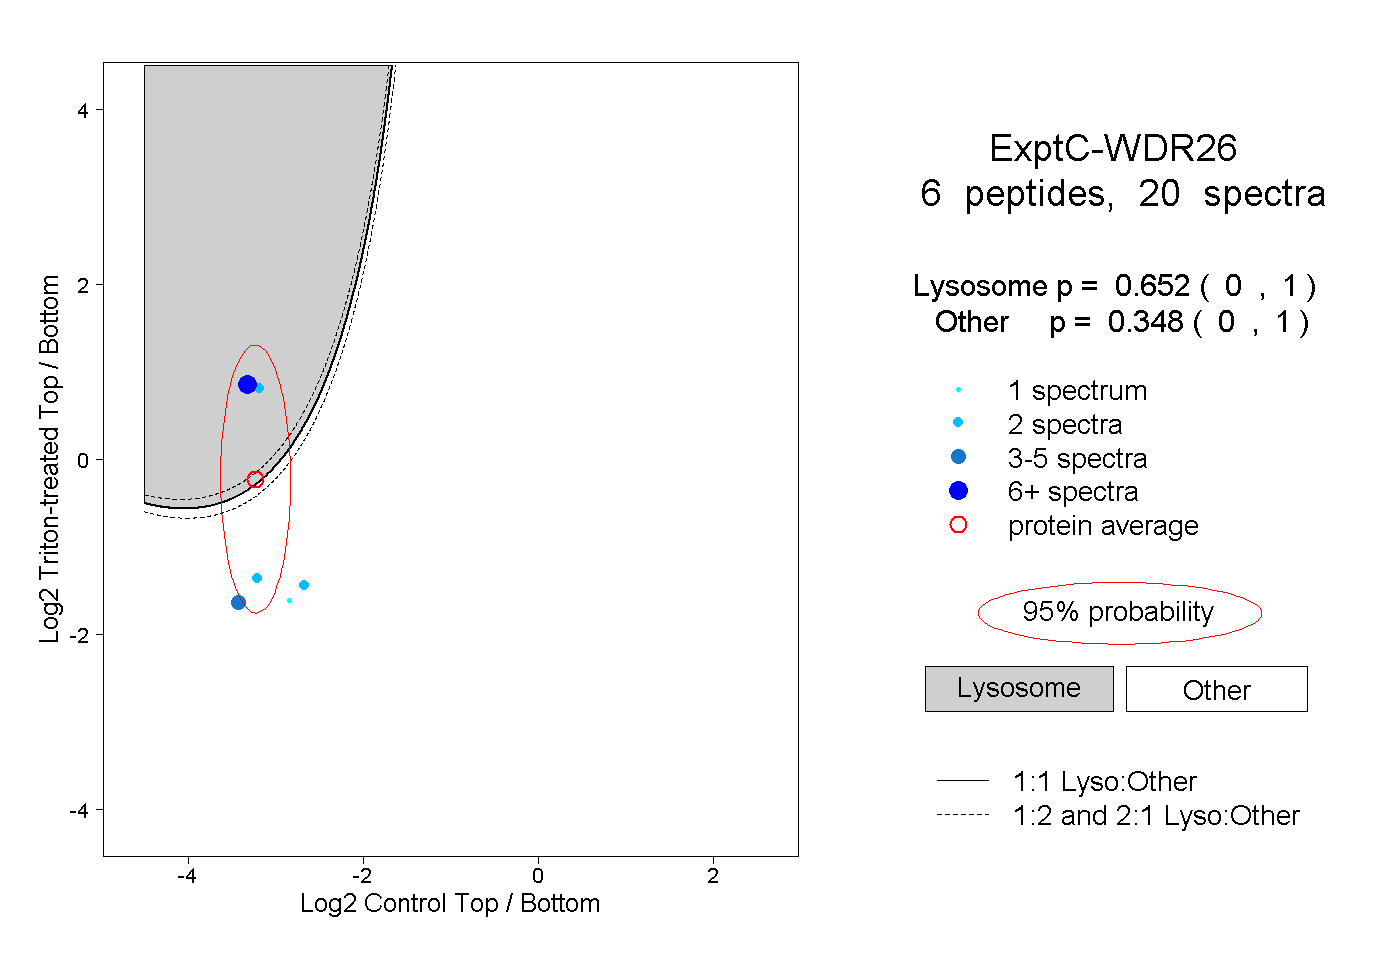
0.000 | 1.000
0.000 | 1.000
1peptide
spectra
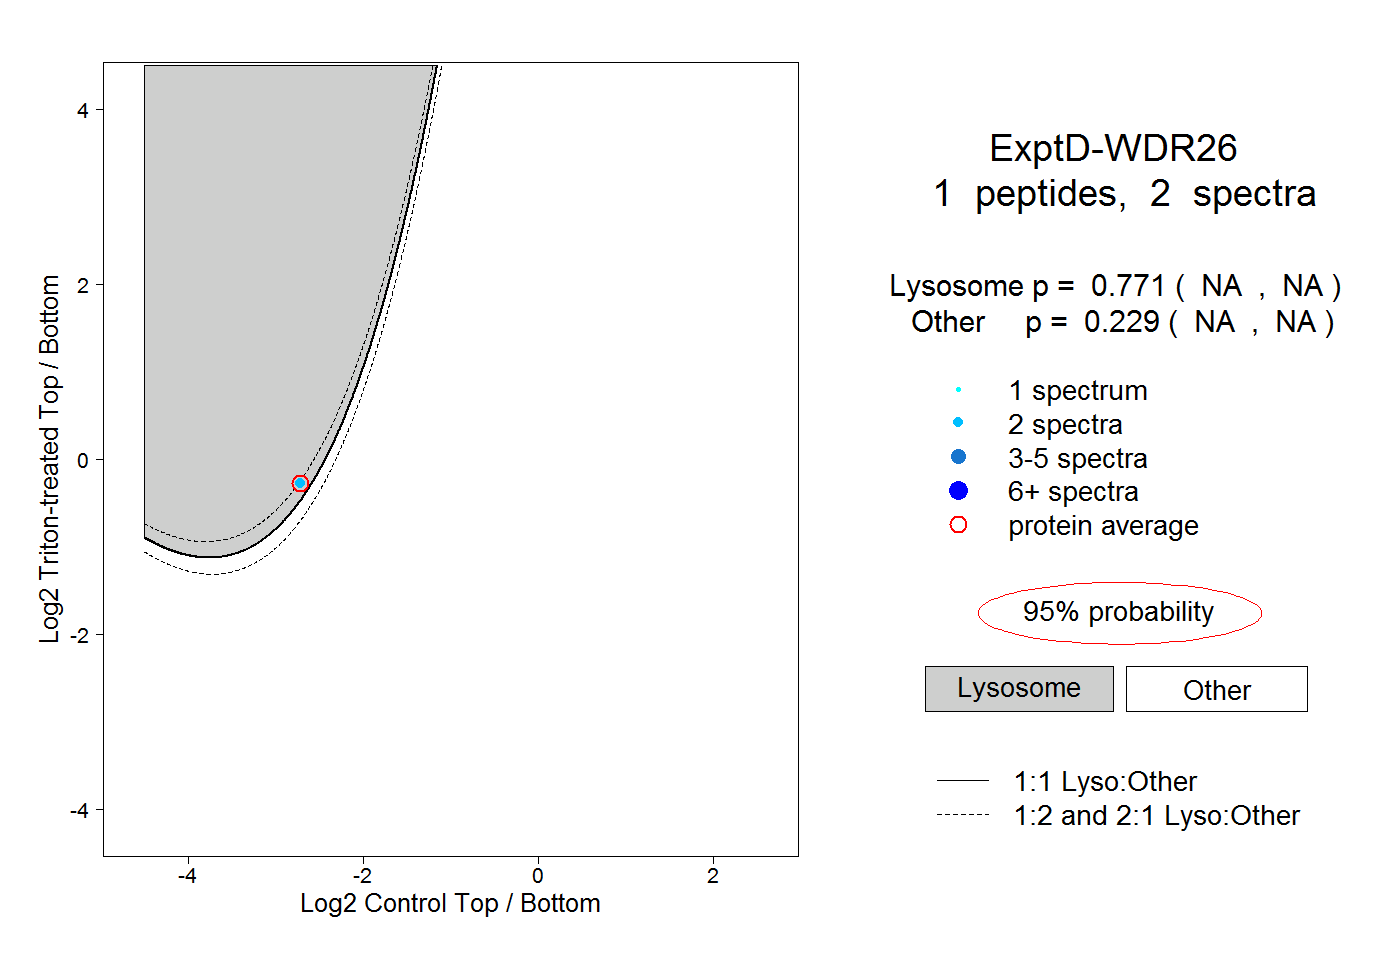
NA | NA
NA | NA