9
9peptides
spectra
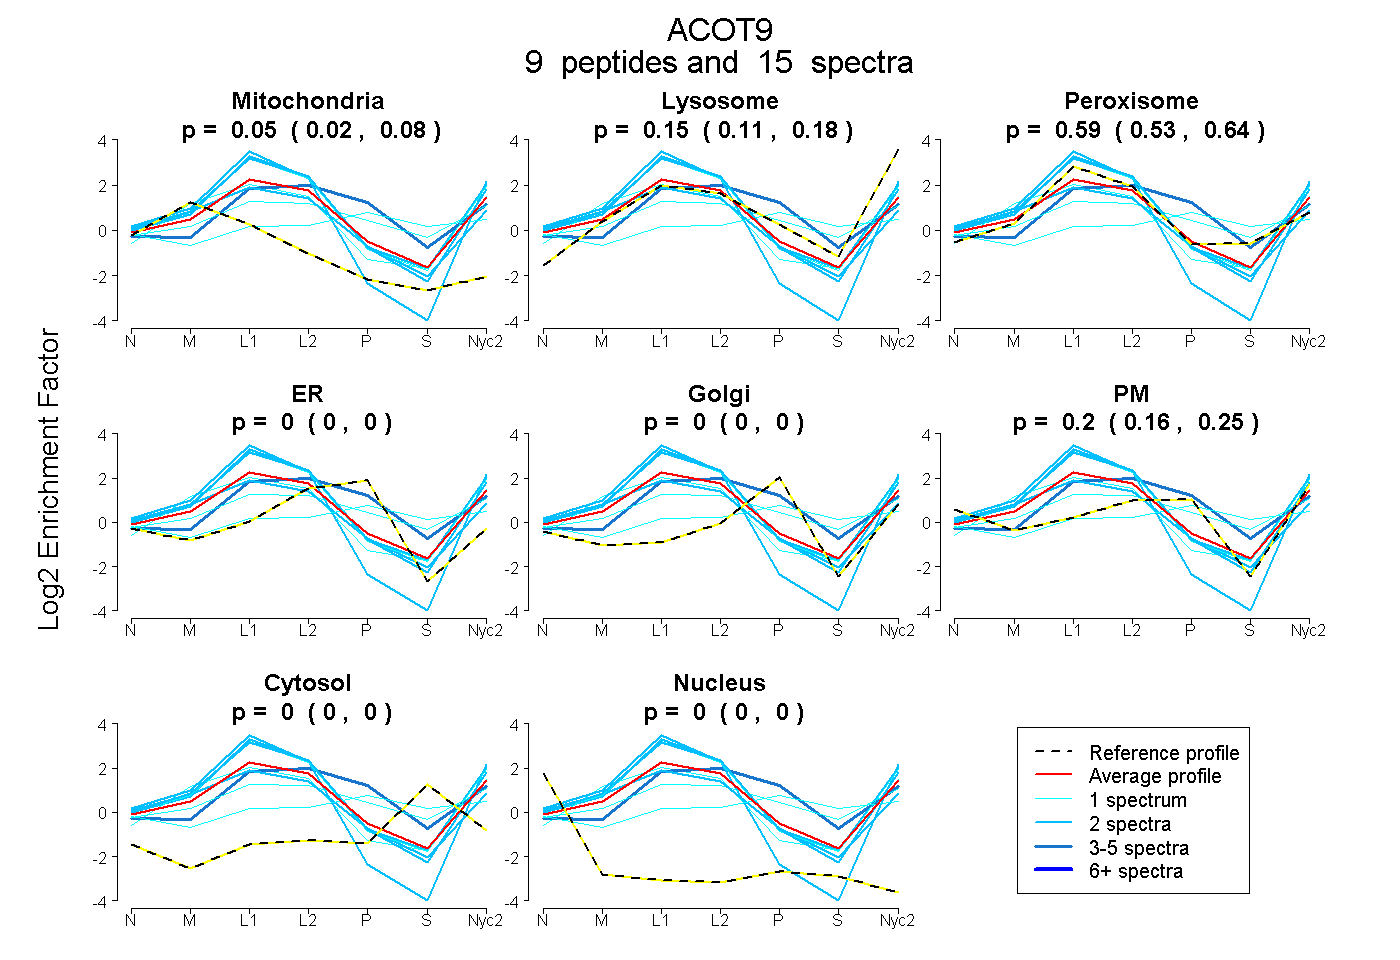
0.019 | 0.082
0.114 | 0.184
0.528 | 0.643
0.000 | 0.000
0.000 | 0.000
0.156 | 0.247
0.000 | 0.000
0.000 | 0.000
2peptides
spectra
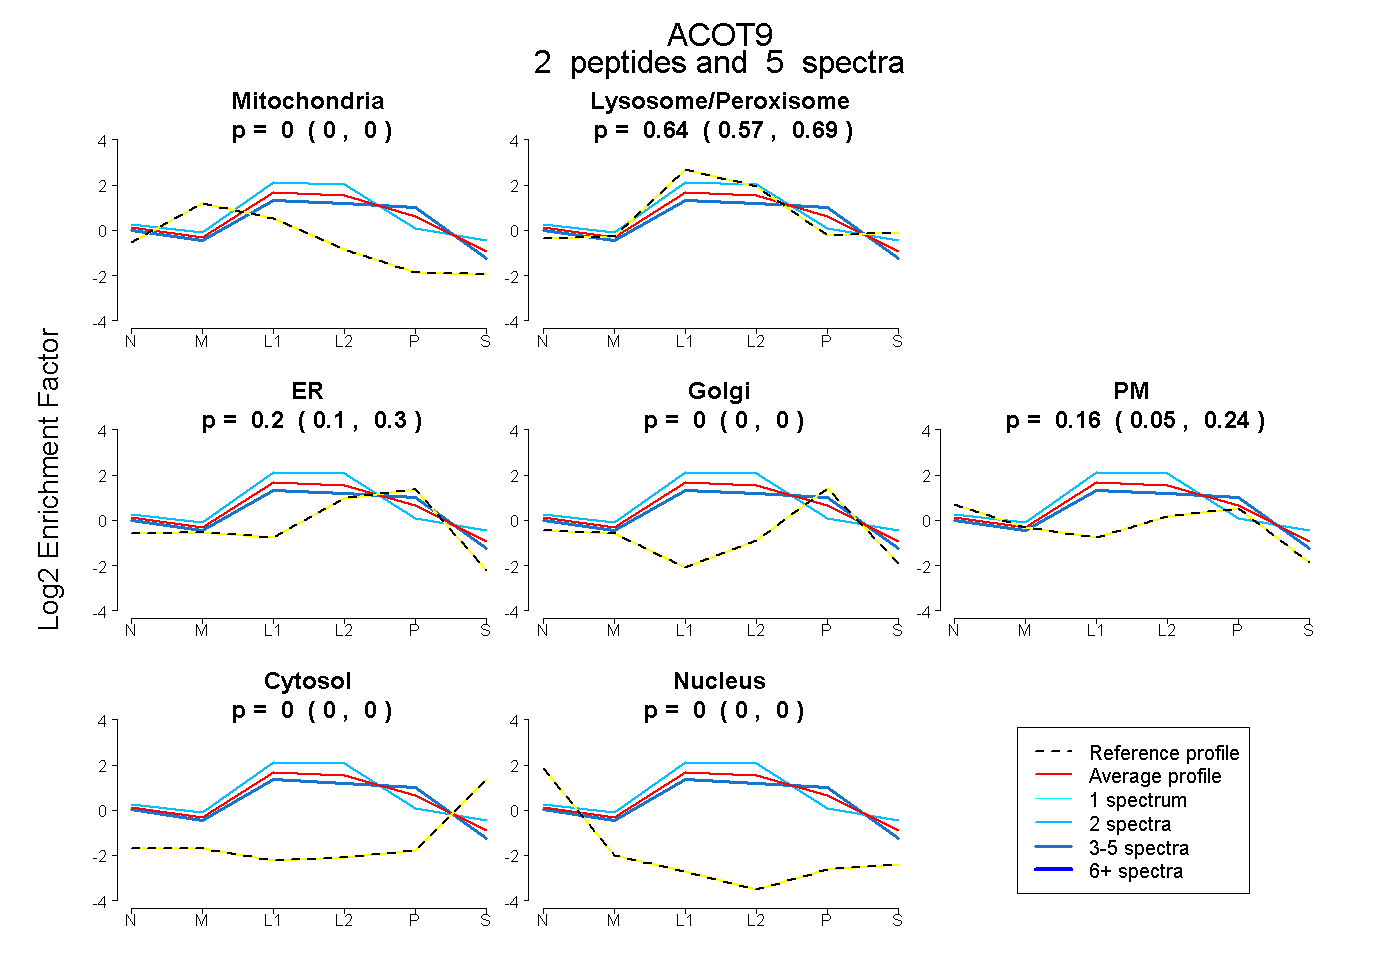
0.000 | 0.000
0.572 | 0.694
0.098 | 0.295
0.000 | 0.000
0.052 | 0.242
0.000 | 0.000
0.000 | 0.000
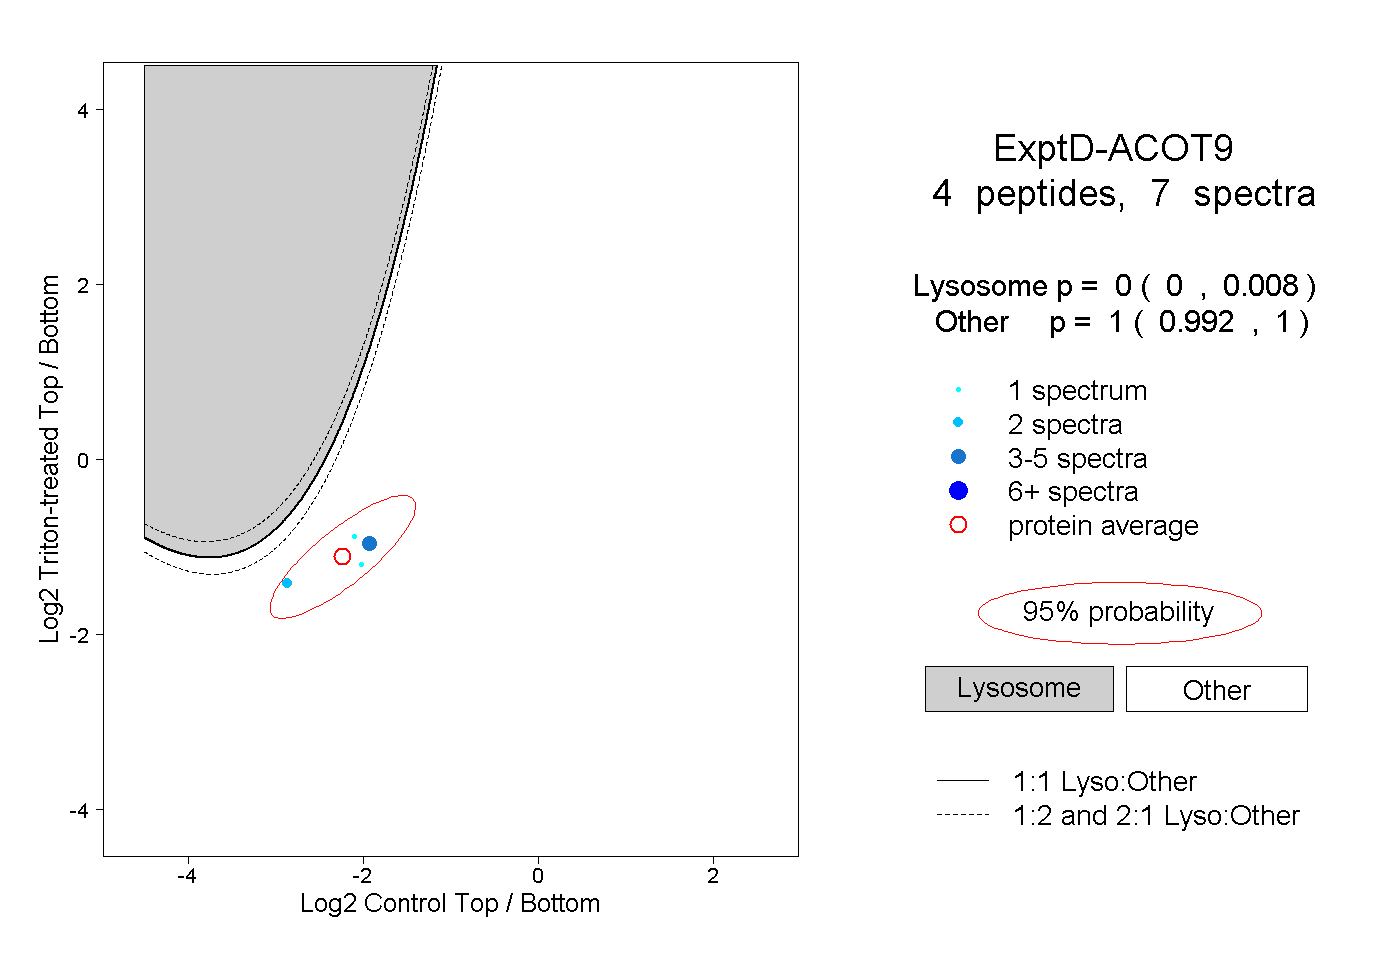
19peptides
spectra
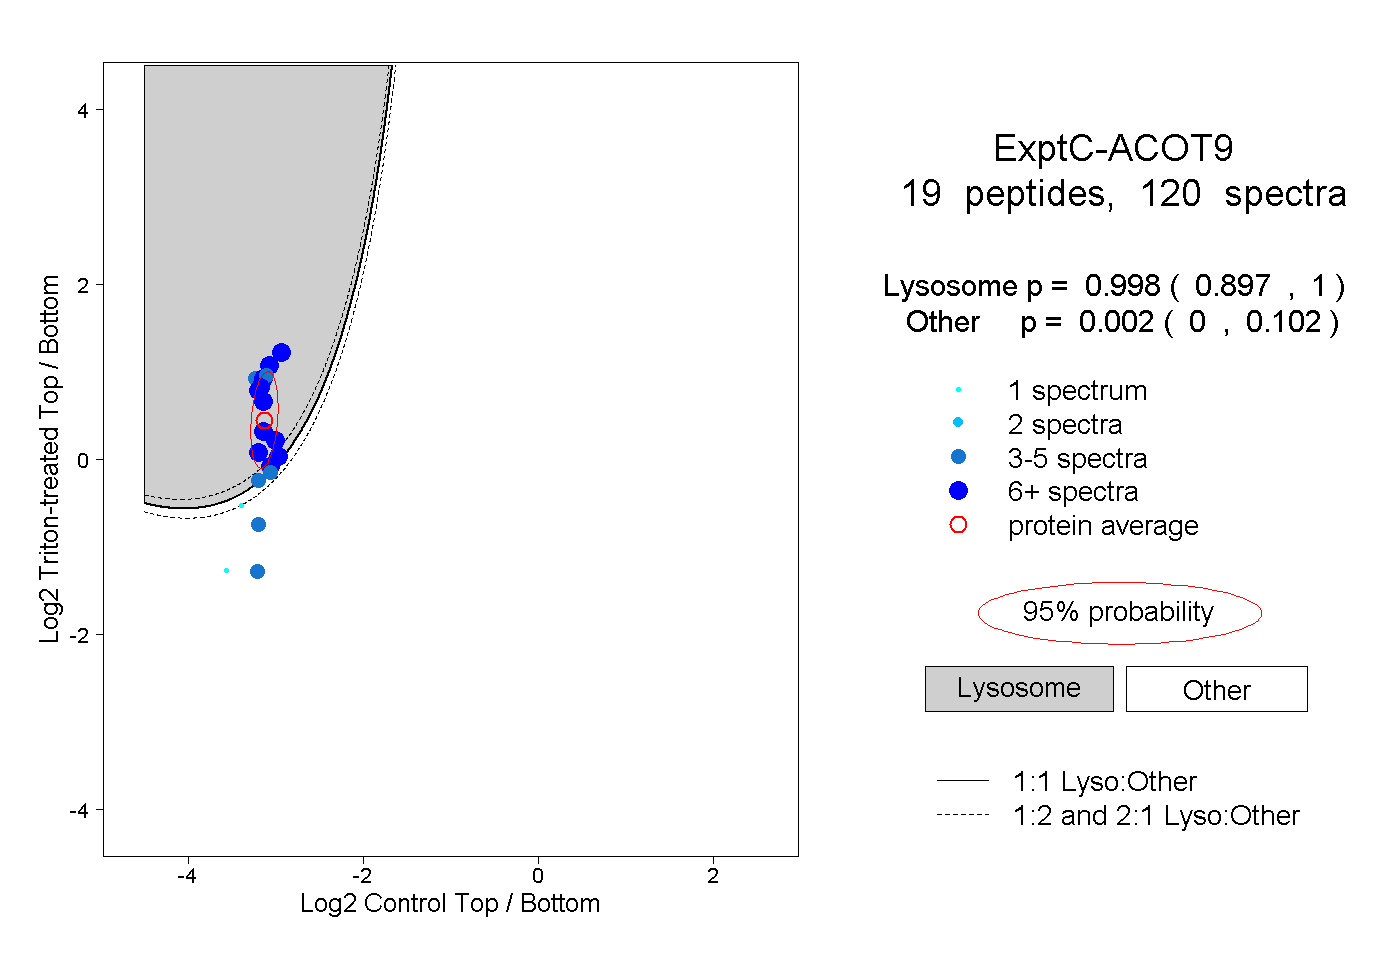
0.897 | 1.000
0.000 | 0.102