ACOT9
[ENSRNOP00000005033]
Main page
| | | Plot |
Mito |
Lyso |
|
Perox |
ER |
Golgi |
PM |
Cytosol |
Nucleus |
|
| Expt A |
 9
9
peptides |
15
spectra |
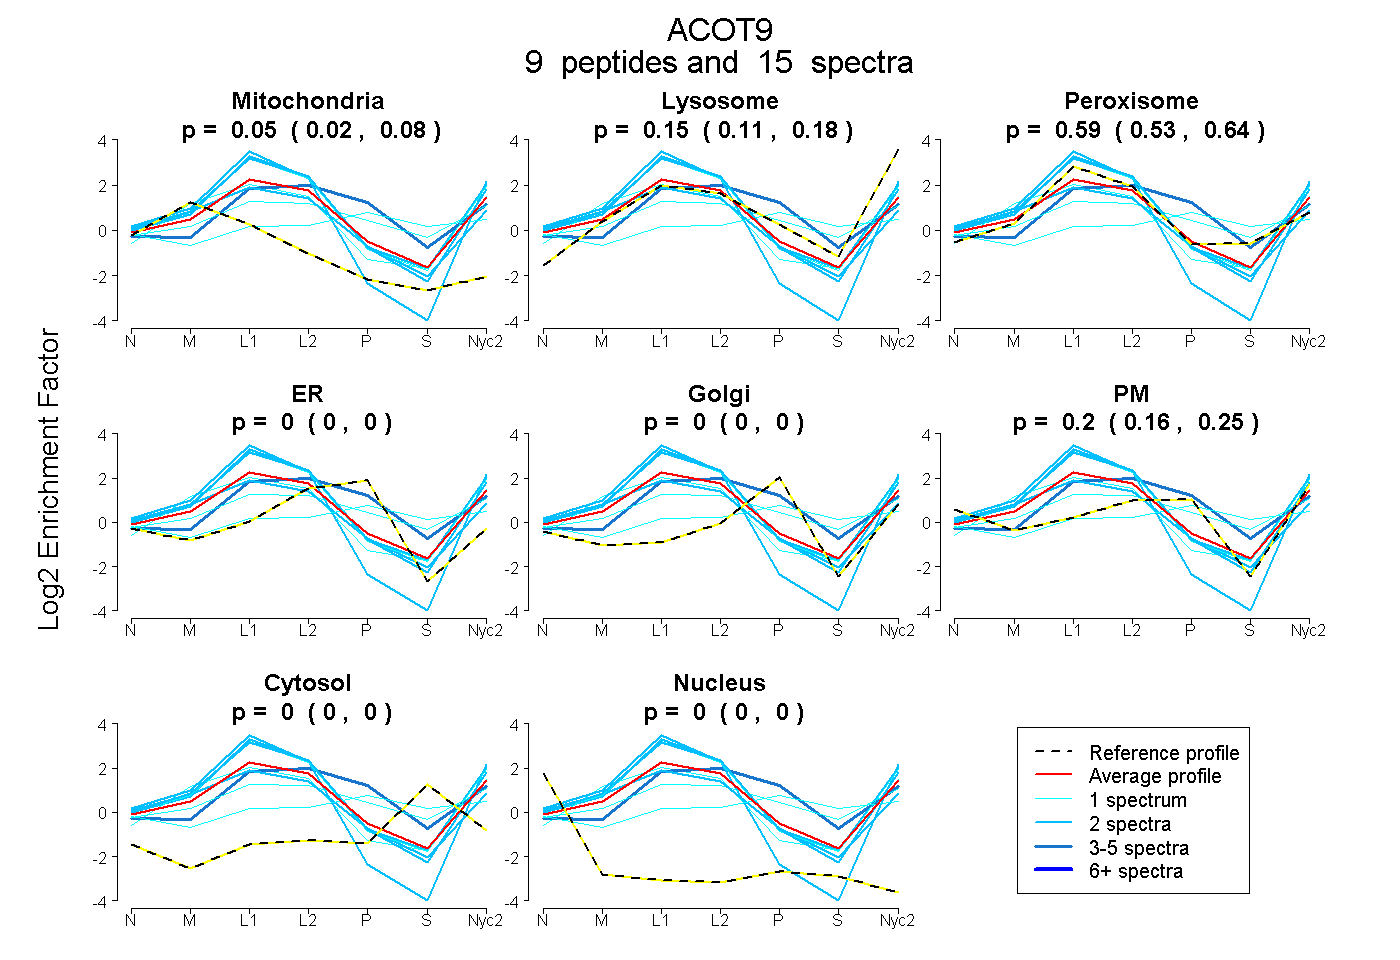 |
0.053
0.019 | 0.082 |
0.151
0.114 | 0.184 |
|
0.591
0.528 | 0.643 |
0.000
0.000 | 0.000 |
0.000
0.000 | 0.000 |
0.205
0.156 | 0.247 |
0.000
0.000 | 0.000 |
0.000
0.000 | 0.000 |
|
| | | Plot |
Mito |
|
Lyso or Perox |
|
ER |
Golgi |
PM |
Cytosol |
Nucleus |
|
| Expt B |
2
peptides |
5
spectra |
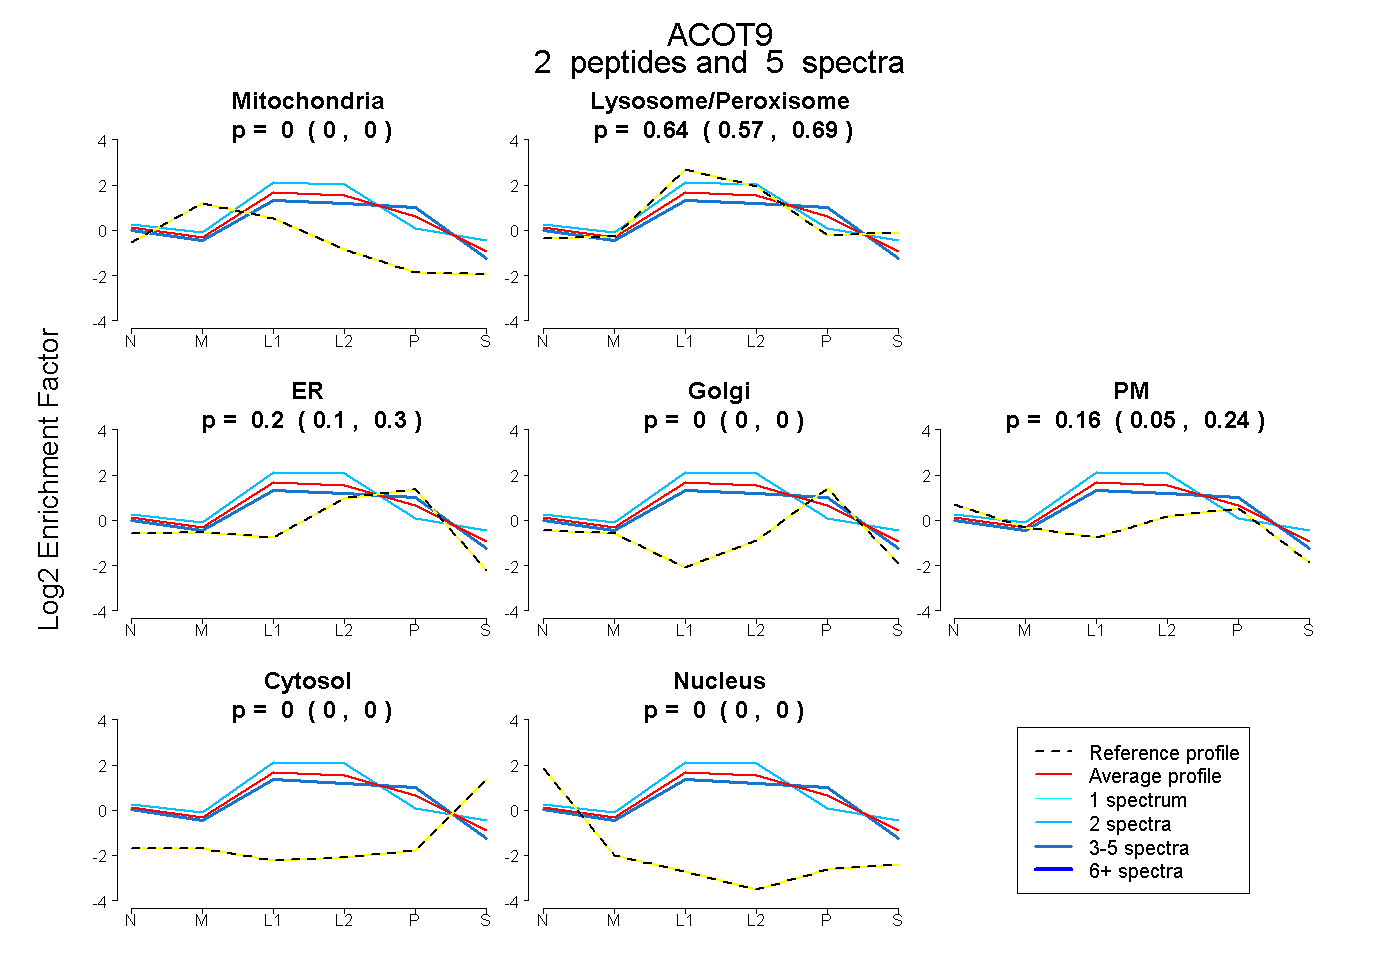 |
0.000
0.000 | 0.000 |
|
0.637
0.572 | 0.694 |
|
0.202
0.098 | 0.295 |
0.000
0.000 | 0.000 |
0.161
0.052 | 0.242 |
0.000
0.000 | 0.000 |
0.000
0.000 | 0.000 |
|
| 2 spectra, YLTVQNTVR |
0.000 |
|
0.839 |
|
0.000 |
0.000 |
0.161 |
0.000 |
0.000 |
|
| 3 spectra, TISFQSR |
0.000 |
|
0.501 |
|
0.362 |
0.000 |
0.137 |
0.000 |
0.000 |
|
| | | Plot |
|
Lyso |
|
|
|
|
|
|
|
Other |
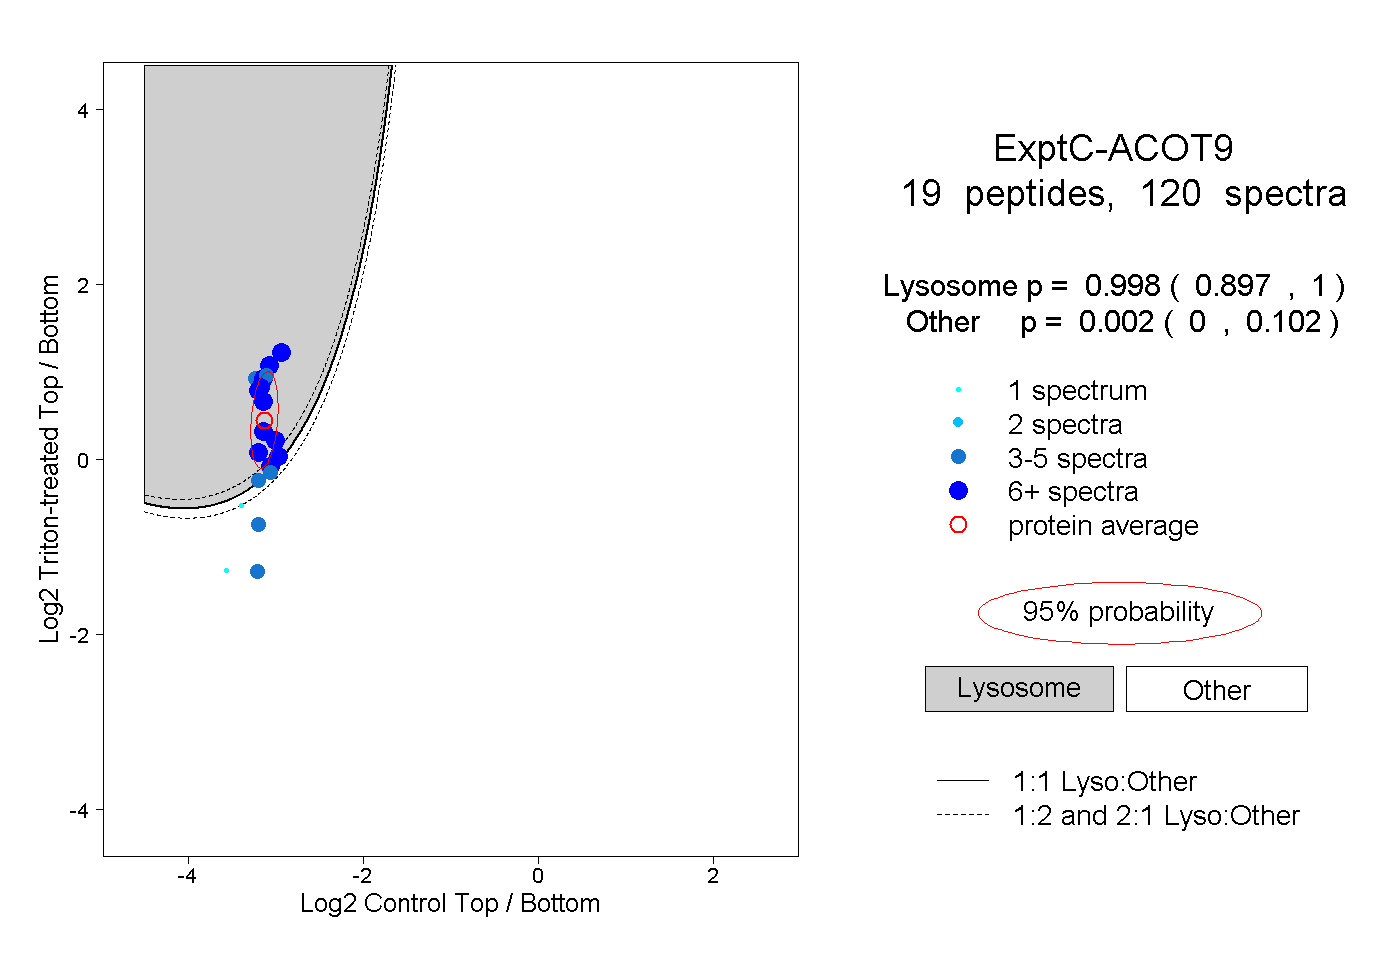
| Expt C |
19
peptides |
120
spectra |
 |
|
0.998
0.897 | 1.000 |
|
|
|
|
|
|
|
0.002
0.000 | 0.102 |
| | | Plot |
|
Lyso |
|
|
|
|
|
|
|
Other |
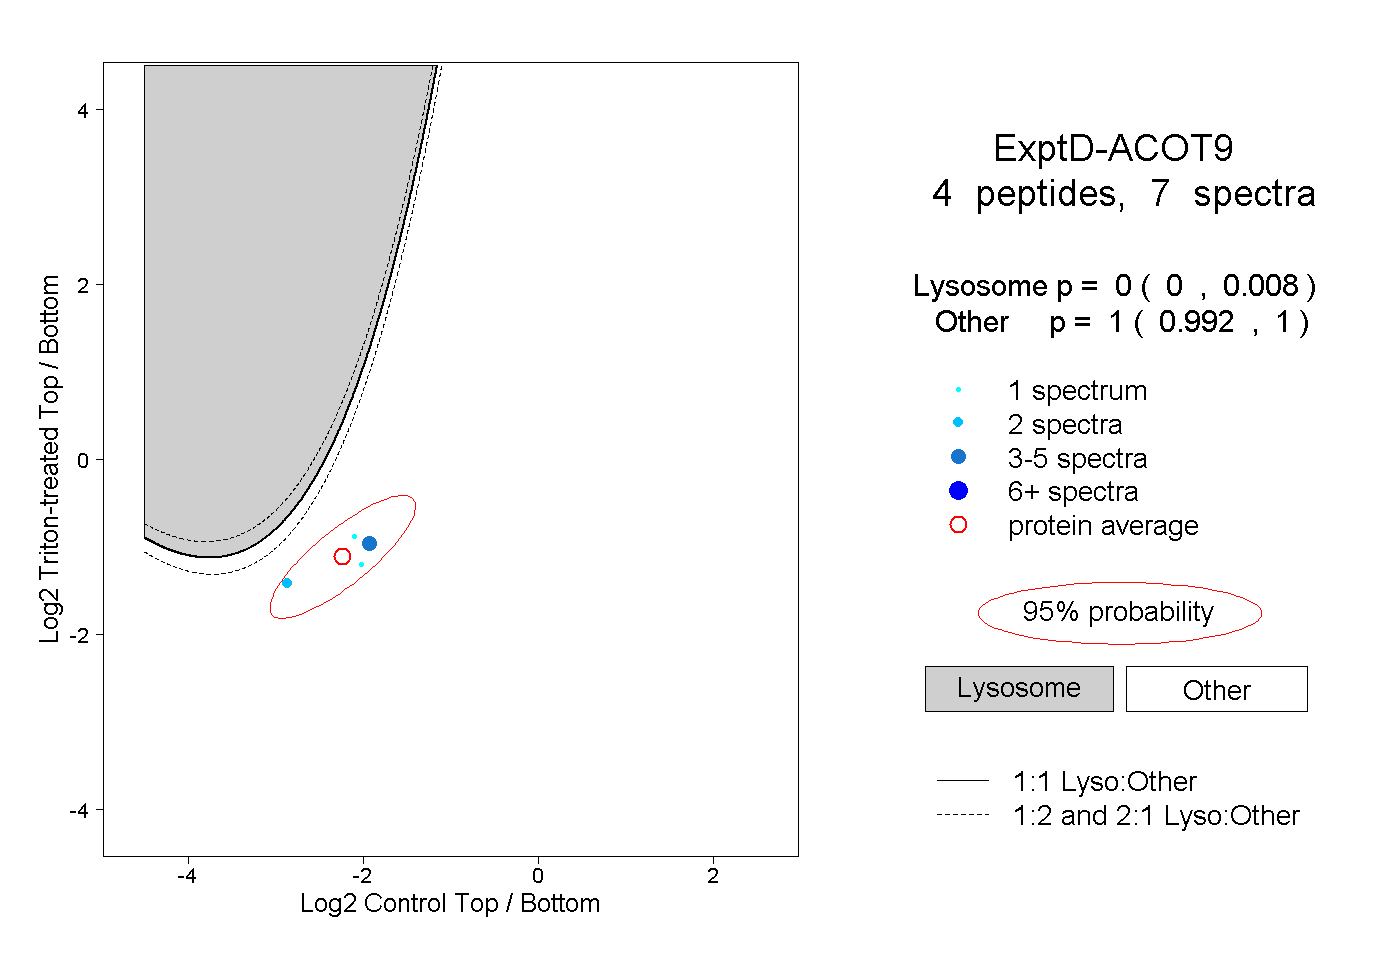
| Expt D |
4
peptides |
7
spectra |
 |
|
0.000
0.000 | 0.008 |
|
|
|
|
|
|
|
1.000
0.992 | 1.000 |