 9
9peptides
spectra
0.019 | 0.082
0.114 | 0.184
0.528 | 0.643
0.000 | 0.000
0.000 | 0.000
0.156 | 0.247
0.000 | 0.000
0.000 | 0.000
| Plot | Mito | Lyso | Perox | ER | Golgi | PM | Cytosol | Nucleus | |||||
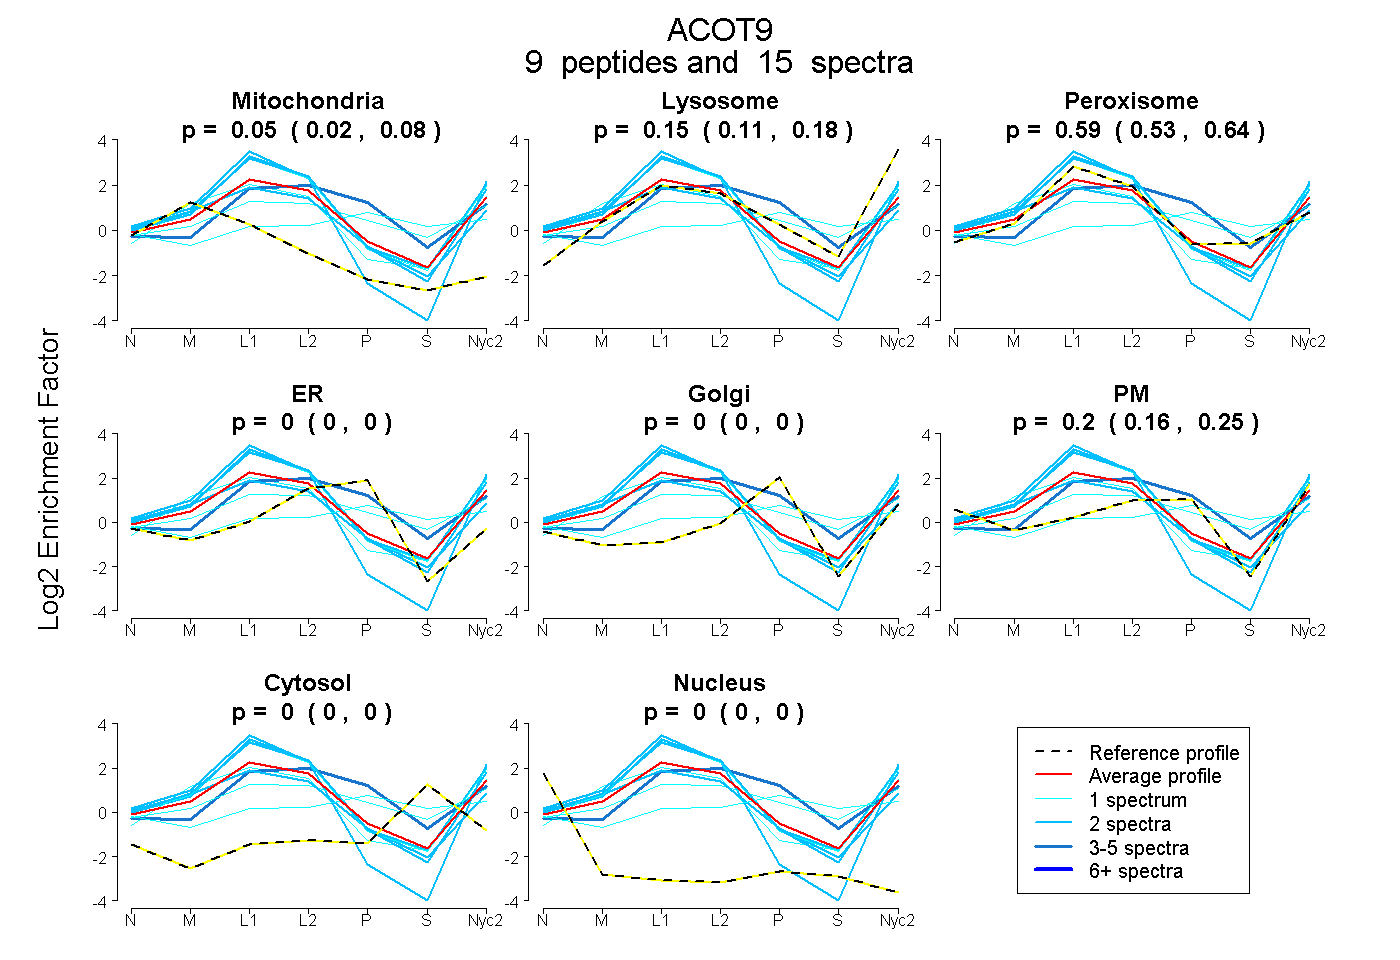
| Expt A |
9 peptides |
15 spectra |
|
0.053 0.019 | 0.082 |
0.151 0.114 | 0.184 |
0.591 0.528 | 0.643 |
0.000 0.000 | 0.000 |
0.000 0.000 | 0.000 |
0.205 0.156 | 0.247 |
0.000 0.000 | 0.000 |
0.000 0.000 | 0.000 |
| 1 spectrum, YLTVQNTVR | 0.000 | 0.000 | 0.321 | 0.000 | 0.318 | 0.065 | 0.295 | 0.000 | ||
| 1 spectrum, IAFSTTSLLK | 0.246 | 0.390 | 0.364 | 0.000 | 0.000 | 0.000 | 0.000 | 0.000 | ||
| 2 spectra, EIVGVSTIWR | 0.000 | 0.275 | 0.725 | 0.000 | 0.000 | 0.000 | 0.000 | 0.000 | ||
| 1 spectrum, NYTVEP | 0.000 | 0.105 | 0.515 | 0.000 | 0.123 | 0.155 | 0.101 | 0.000 | ||
| 2 spectra, TISFQSR | 0.206 | 0.084 | 0.484 | 0.000 | 0.000 | 0.226 | 0.000 | 0.000 | ||
| 3 spectra, LLHNFLATSQK | 0.000 | 0.216 | 0.426 | 0.358 | 0.000 | 0.000 | 0.000 | 0.000 | ||
| 2 spectra, VAPNSEER | 0.000 | 0.200 | 0.711 | 0.000 | 0.000 | 0.089 | 0.000 | 0.000 | ||
| 2 spectra, MSPLSIVTVLVDK | 0.192 | 0.366 | 0.442 | 0.000 | 0.000 | 0.000 | 0.000 | 0.000 | ||
| 1 spectrum, TYGESMLYLDGQR | 0.000 | 0.255 | 0.735 | 0.000 | 0.000 | 0.010 | 0.000 | 0.000 |
| Plot | Mito | Lyso or Perox | ER | Golgi | PM | Cytosol | Nucleus | ||||||
| Expt B |
2 peptides |
5 spectra |
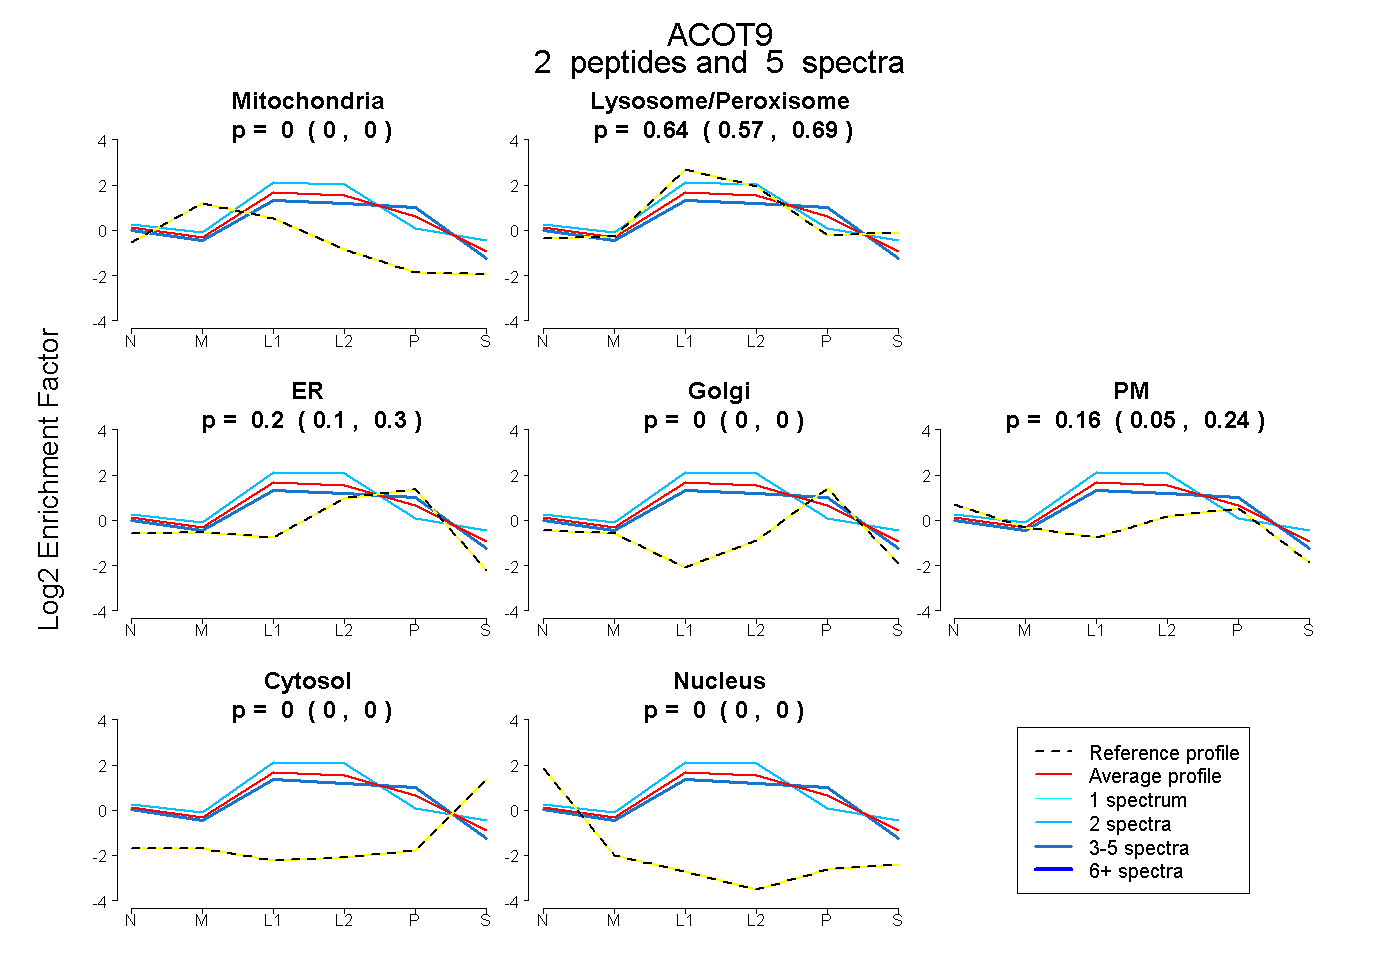 |
0.000 0.000 | 0.000 |
0.637 0.572 | 0.694 |
0.202 0.098 | 0.295 |
0.000 0.000 | 0.000 |
0.161 0.052 | 0.242 |
0.000 0.000 | 0.000 |
0.000 0.000 | 0.000 |
|||
| Plot | Lyso | Other | |||||||||||
| Expt C |
19 peptides |
120 spectra |
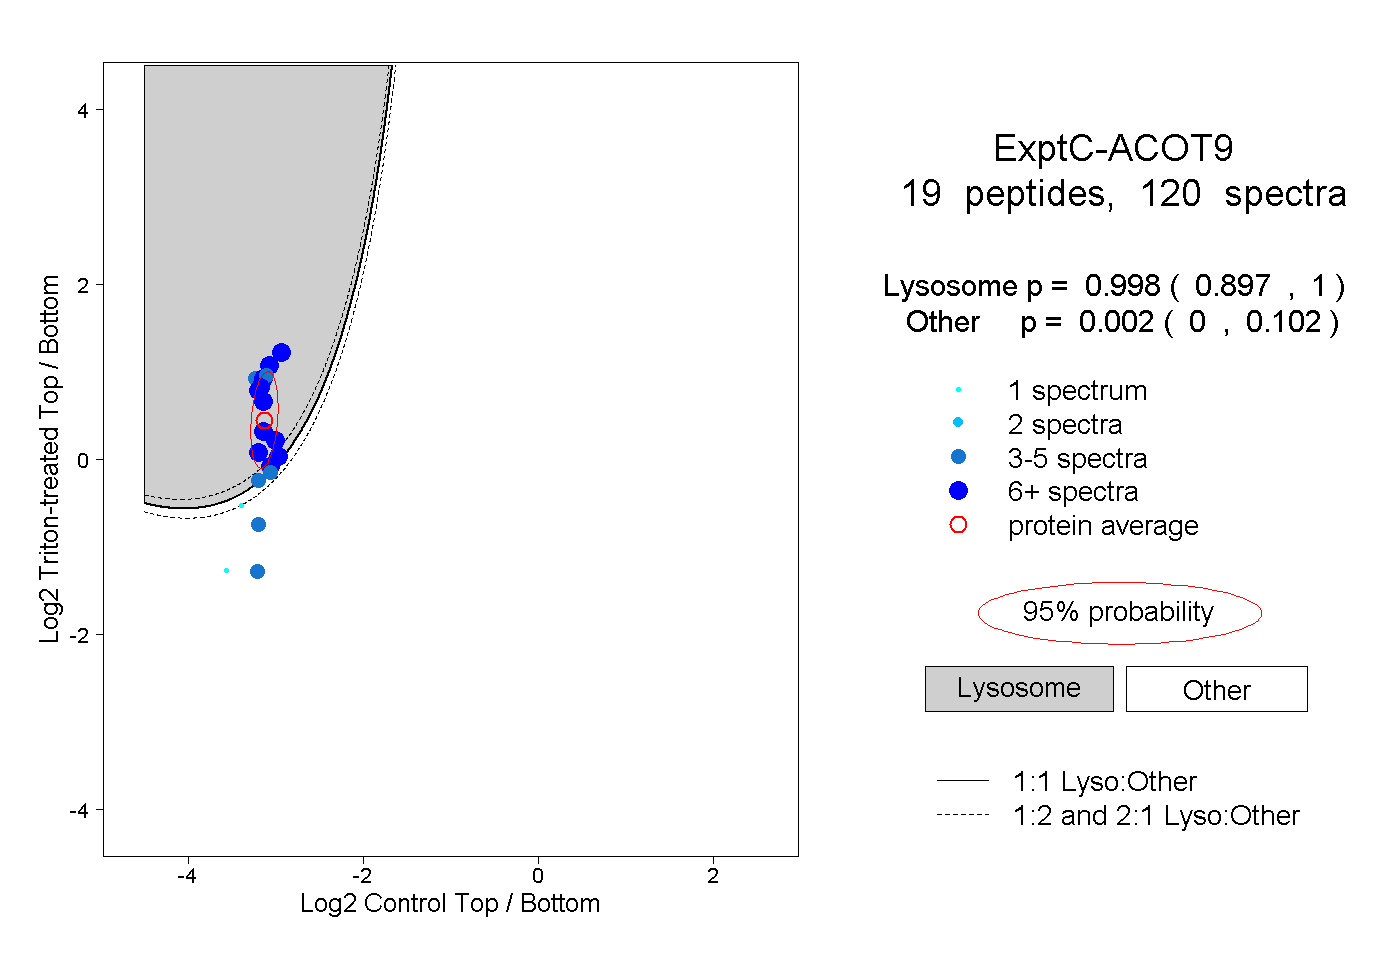 |
0.998 0.897 | 1.000 |
0.002 0.000 | 0.102 |
||||||||
| Plot | Lyso | Other | |||||||||||
| Expt D |
4 peptides |
7 spectra |
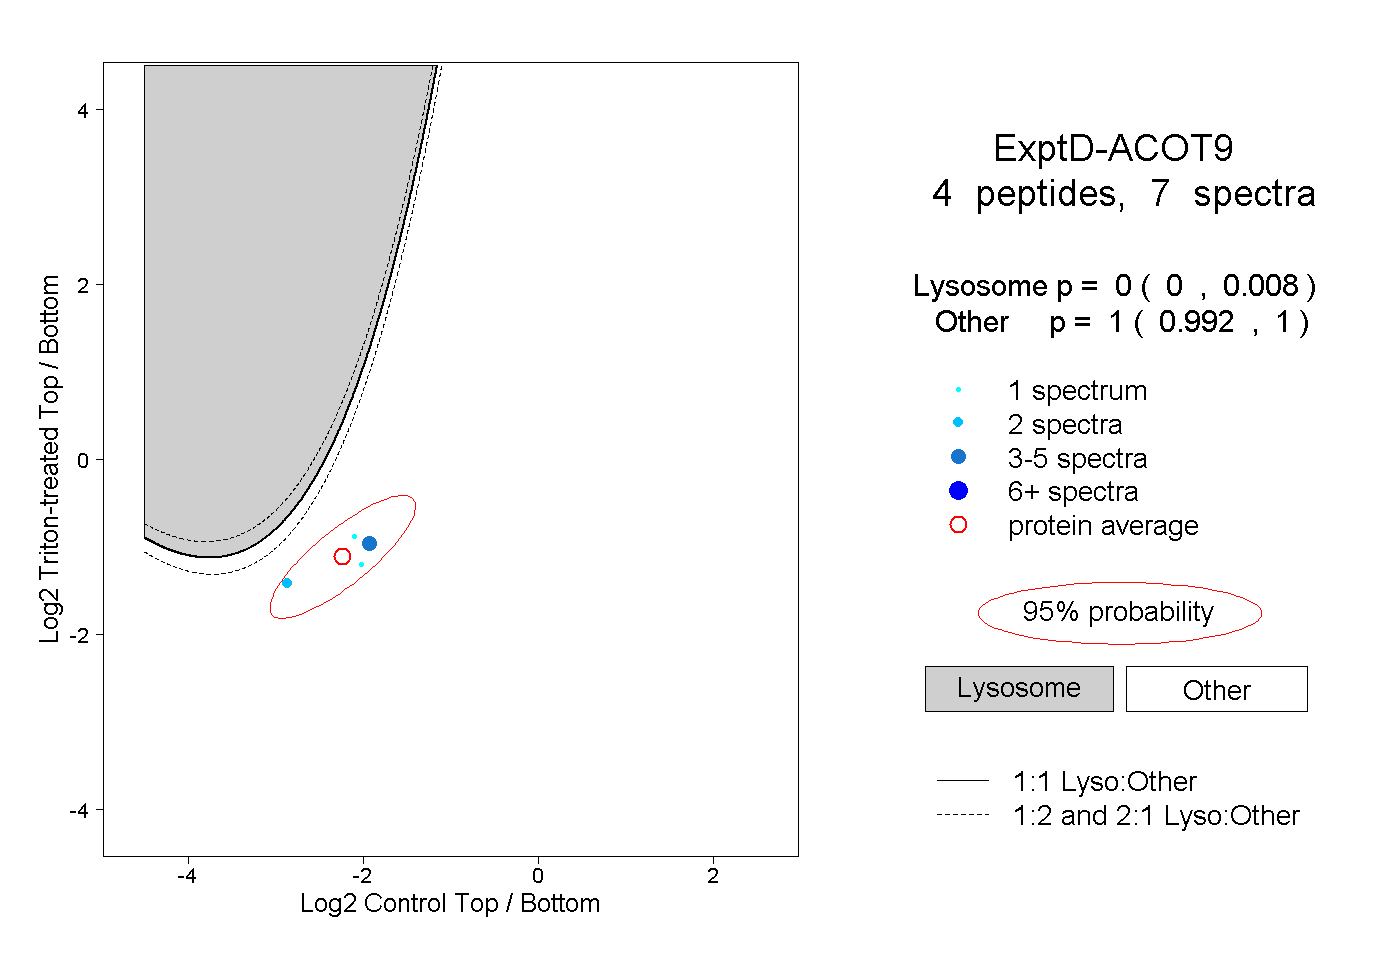 |
0.000 0.000 | 0.008 |
1.000 0.992 | 1.000 |