9
9peptides
spectra
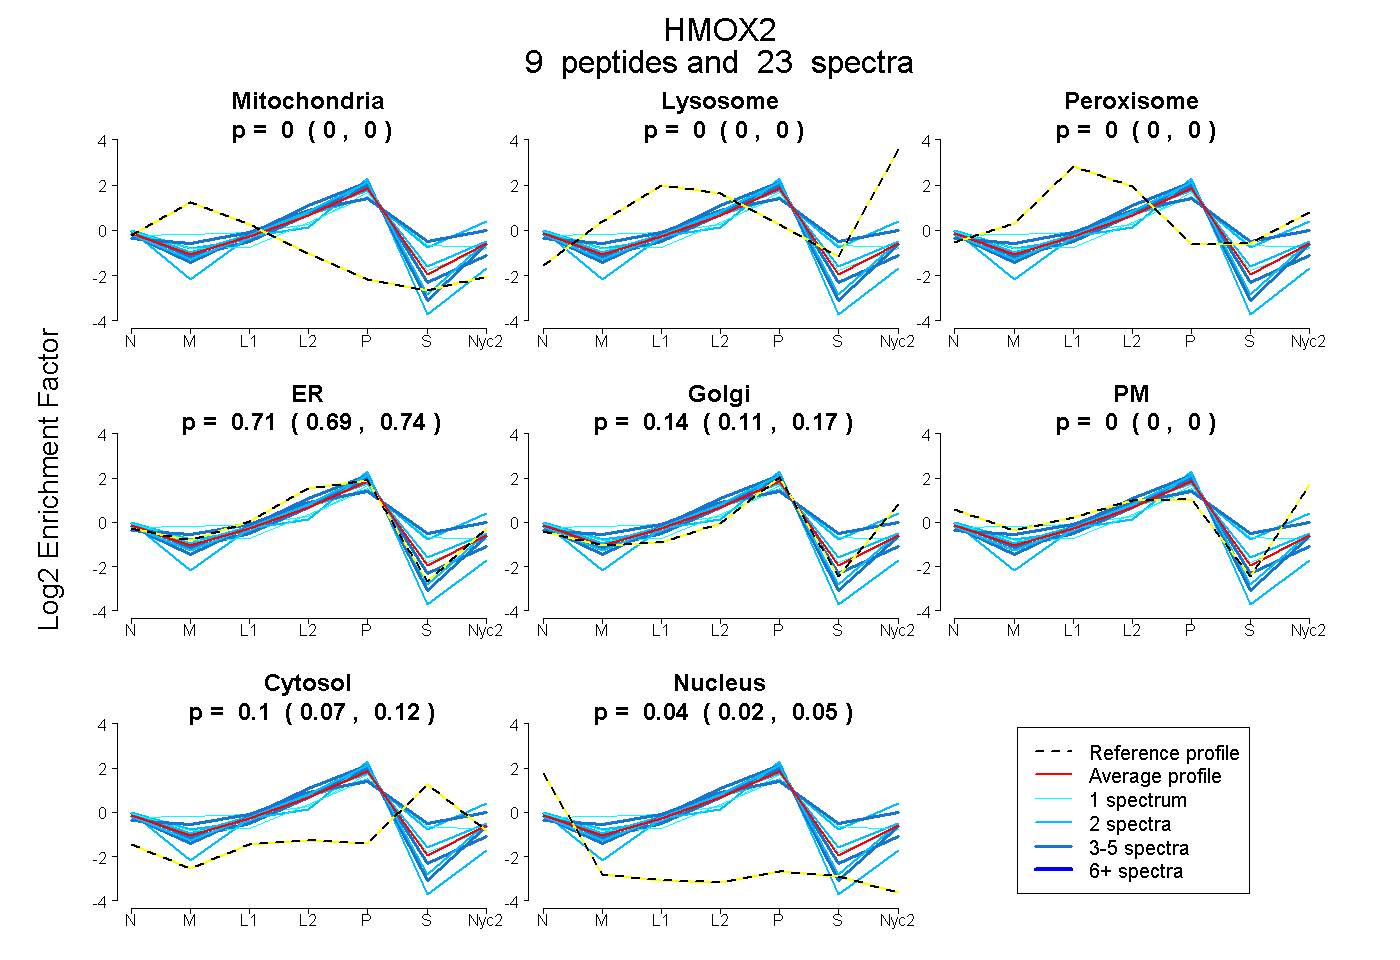
0.000 | 0.000
0.000 | 0.000
0.000 | 0.000
0.689 | 0.737
0.111 | 0.172
0.000 | 0.000
0.072 | 0.124
0.025 | 0.053
3peptides
spectra
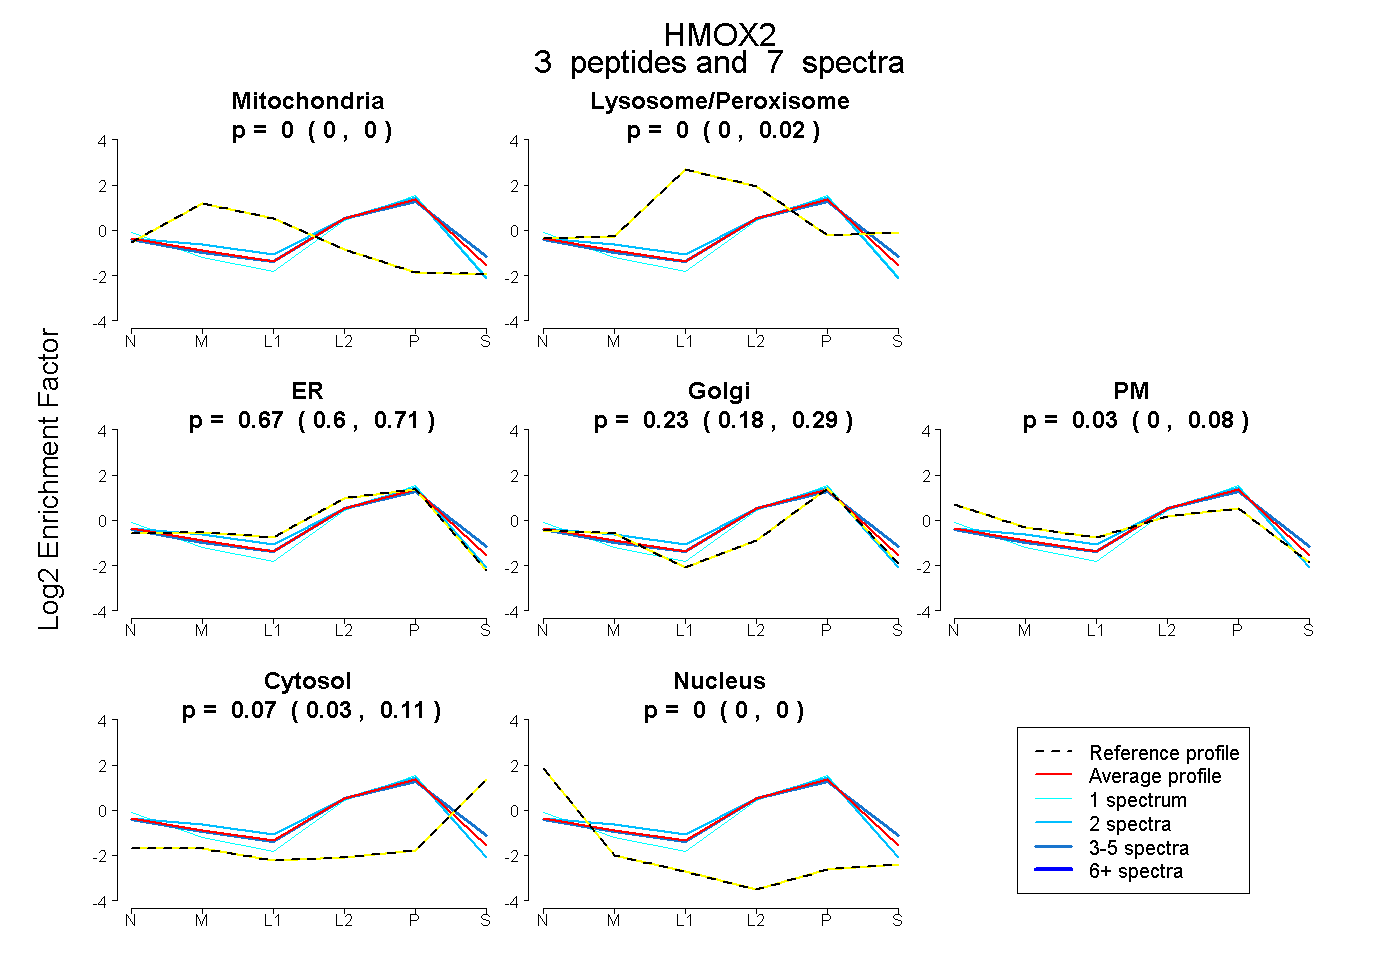
0.000 | 0.000
0.000 | 0.016
0.601 | 0.707
0.176 | 0.285
0.000 | 0.075
0.032 | 0.107
0.000 | 0.000