 2
2peptides
spectra
0.000 | 0.000
0.000 | 0.000
0.000 | 0.038
0.000 | 0.175
0.000 | 0.079
0.454 | 0.668
0.271 | 0.331
0.000 | 0.059
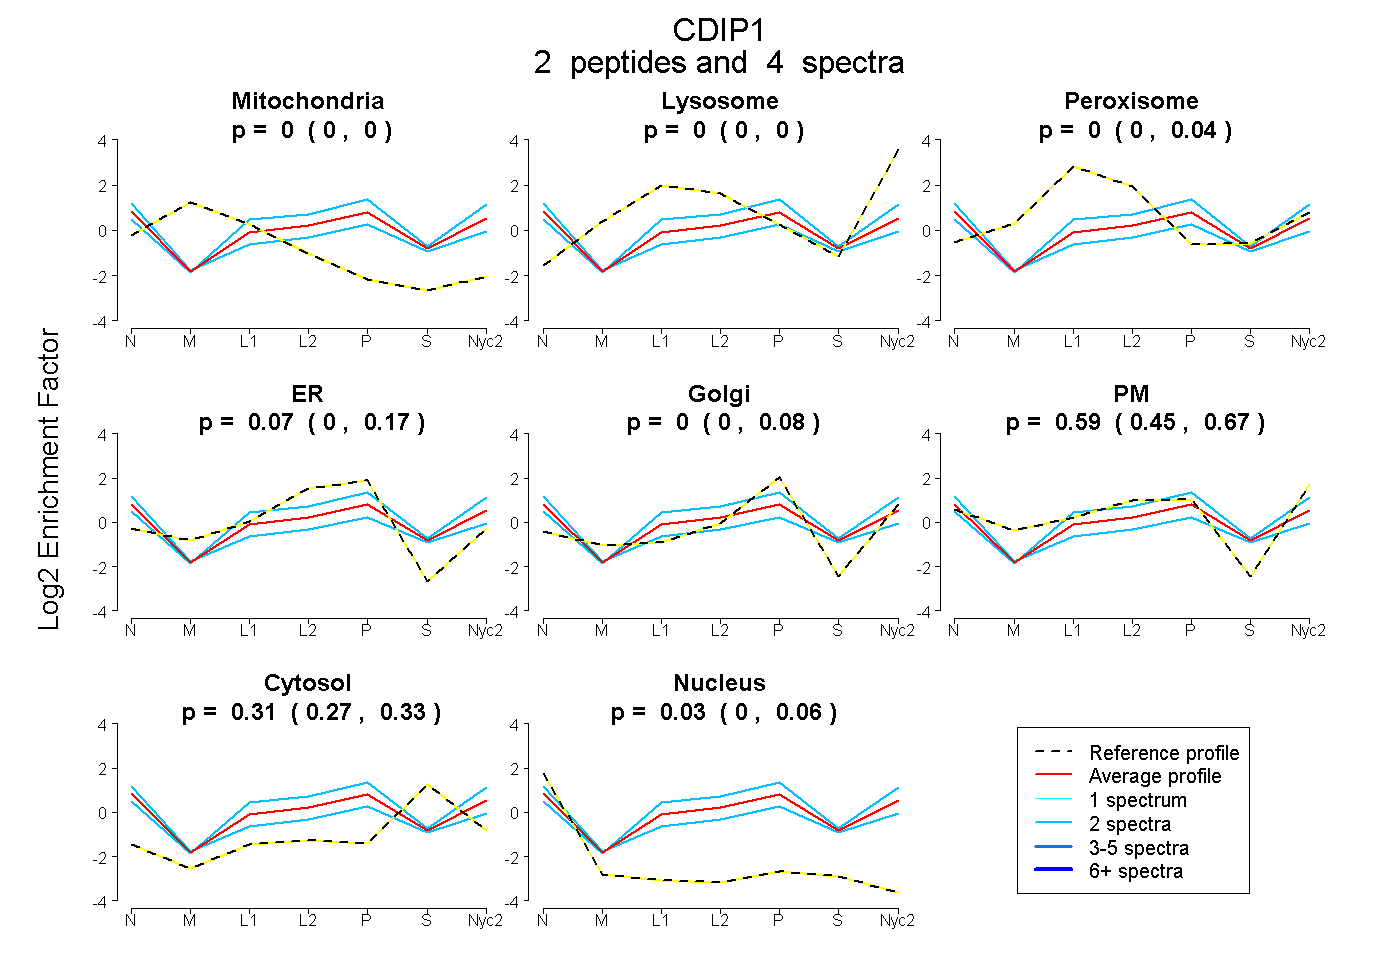
| Plot | Mito | Lyso | Perox | ER | Golgi | PM | Cytosol | Nucleus | |||||
| Expt A |
2 peptides |
4 spectra |
|
0.000 0.000 | 0.000 |
0.000 0.000 | 0.000 |
0.000 0.000 | 0.038 |
0.072 0.000 | 0.175 |
0.000 0.000 | 0.079 |
0.593 0.454 | 0.668 |
0.309 0.271 | 0.331 |
0.026 0.000 | 0.059 |
| 2 spectra, SGAPHTPGR | 0.000 | 0.000 | 0.079 | 0.077 | 0.059 | 0.565 | 0.220 | 0.000 | ||
| 2 spectra, DVTHTCPSCK | 0.000 | 0.000 | 0.000 | 0.000 | 0.000 | 0.557 | 0.269 | 0.173 |