 5
5peptides
spectra
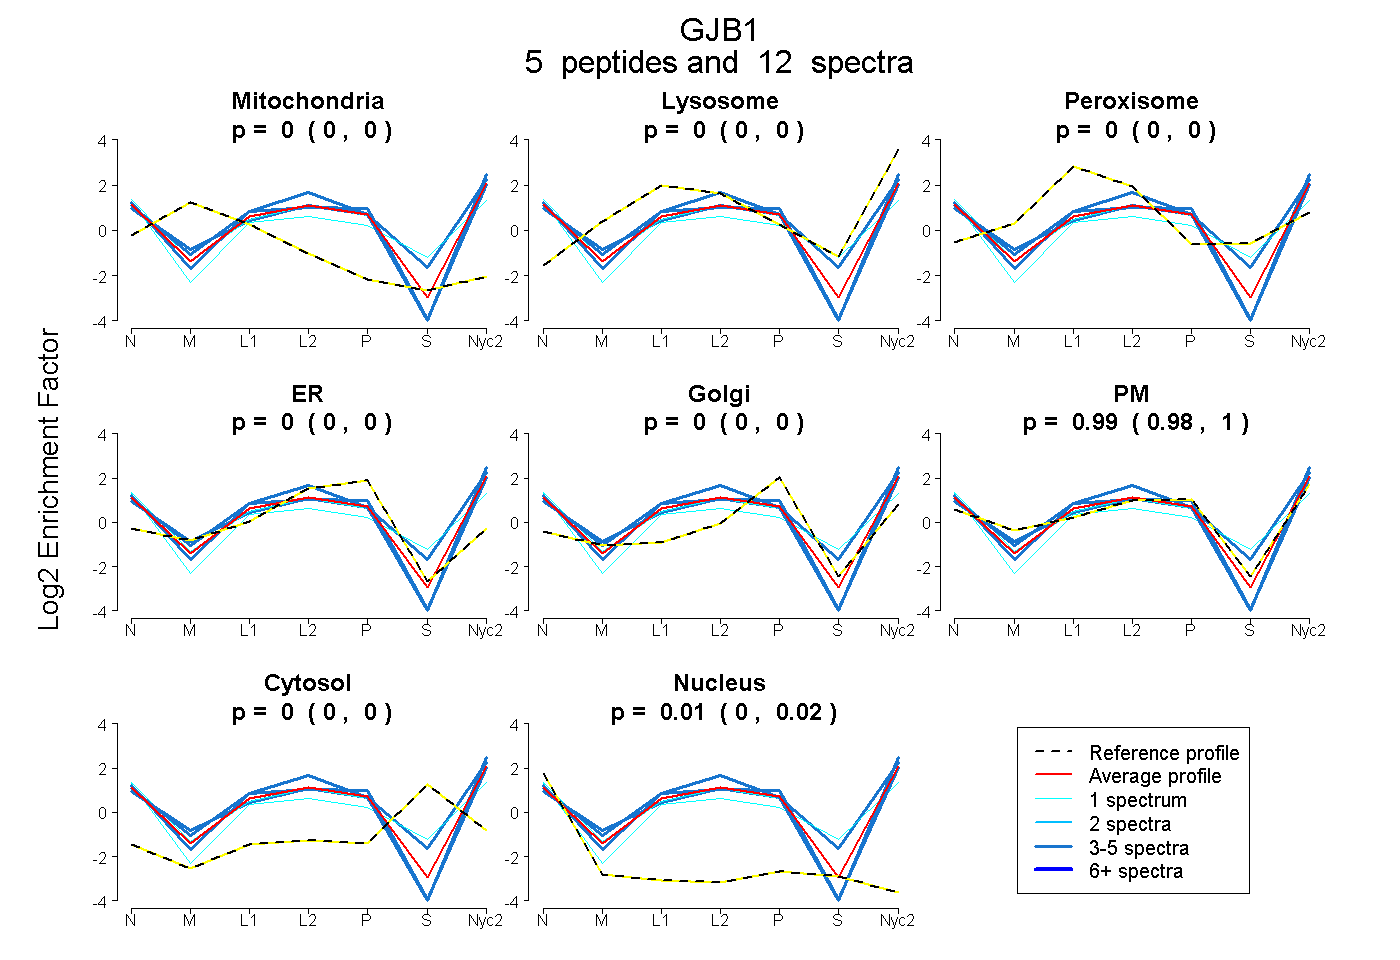
0.000 | 0.000
0.000 | 0.000
0.000 | 0.000
0.000 | 0.000
0.000 | 0.000
0.979 | 0.999
0.000 | 0.000
0.000 | 0.020
| Plot | Mito | Lyso | Perox | ER | Golgi | PM | Cytosol | Nucleus | |||||
| Expt A |
5 peptides |
12 spectra |
|
0.000 0.000 | 0.000 |
0.000 0.000 | 0.000 |
0.000 0.000 | 0.000 |
0.000 0.000 | 0.000 |
0.000 0.000 | 0.000 |
0.990 0.979 | 0.999 |
0.000 0.000 | 0.000 |
0.010 0.000 | 0.020 |
| 1 spectrum, LLSEQDGSLK | 0.000 | 0.000 | 0.000 | 0.000 | 0.000 | 0.968 | 0.000 | 0.032 | ||
| 1 spectrum, QNEINK | 0.000 | 0.000 | 0.038 | 0.000 | 0.000 | 0.710 | 0.213 | 0.039 | ||
| 3 spectra, SPGTGAGLAEK | 0.000 | 0.000 | 0.000 | 0.000 | 0.000 | 0.989 | 0.000 | 0.011 | ||
| 4 spectra, SNPPSR | 0.000 | 0.000 | 0.000 | 0.000 | 0.000 | 1.000 | 0.000 | 0.000 | ||
| 3 spectra, LEGHGDPLHLEEVK | 0.000 | 0.112 | 0.004 | 0.000 | 0.000 | 0.837 | 0.047 | 0.000 |
| Plot | Mito | Lyso or Perox | ER | Golgi | PM | Cytosol | Nucleus | ||||||
| Expt B |
3 peptides |
3 spectra |
 |
0.000 0.000 | 0.000 |
0.244 0.208 | 0.273 |
0.000 0.000 | 0.000 |
0.000 0.000 | 0.000 |
0.641 0.579 | 0.689 |
0.079 0.043 | 0.110 |
0.036 0.000 | 0.067 |
|||
| Plot | Lyso | Other | |||||||||||
| Expt C |
5 peptides |
59 spectra |
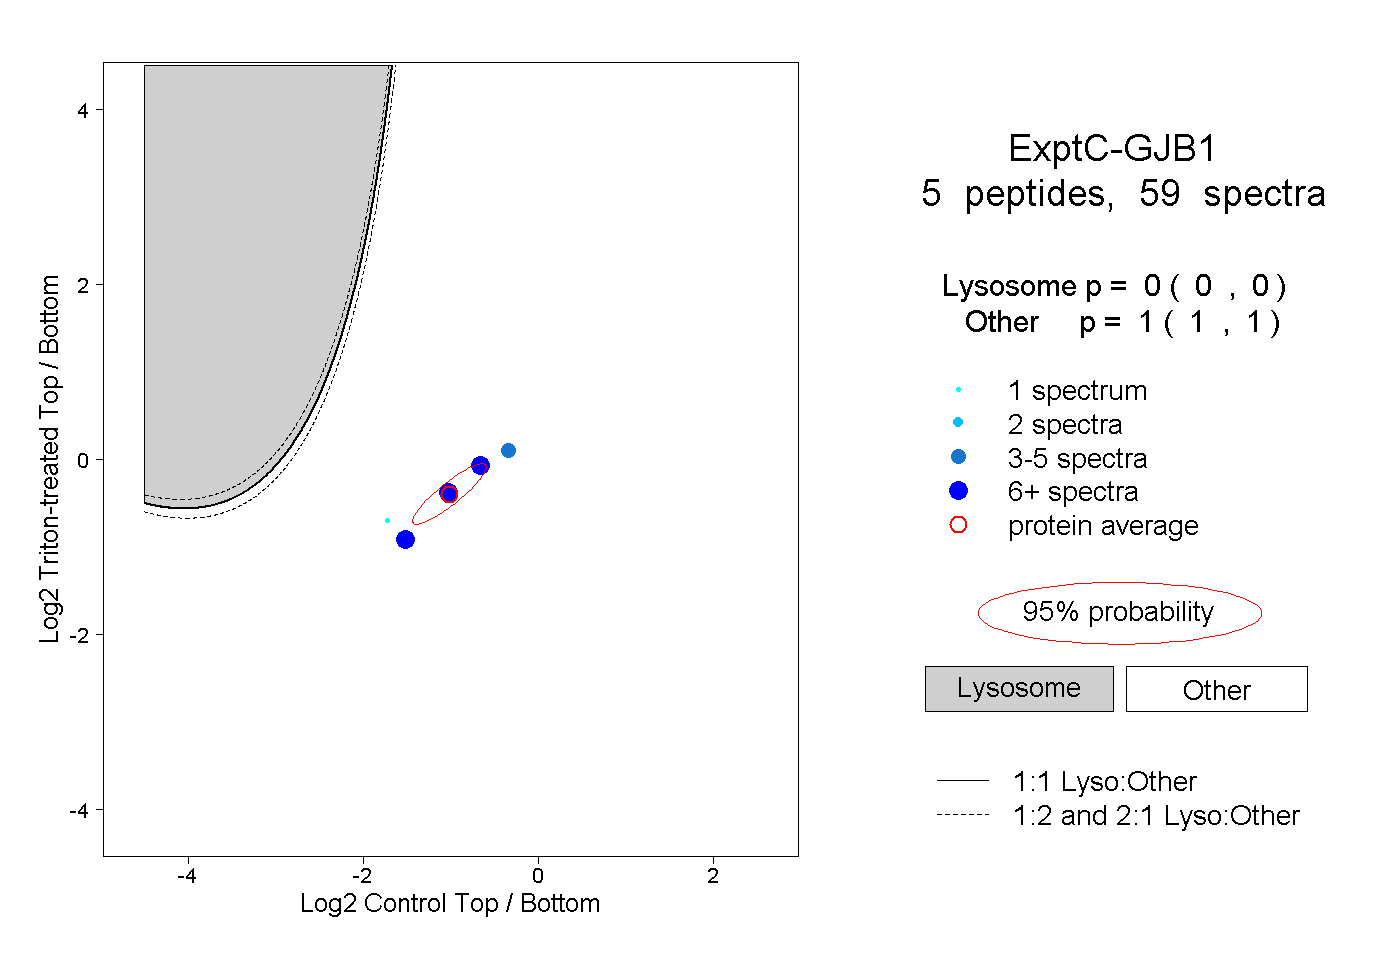 |
0.000 0.000 | 0.000 |
1.000 1.000 | 1.000 |
||||||||
| Plot | Lyso | Other | |||||||||||
| Expt D |
4 peptides |
5 spectra |
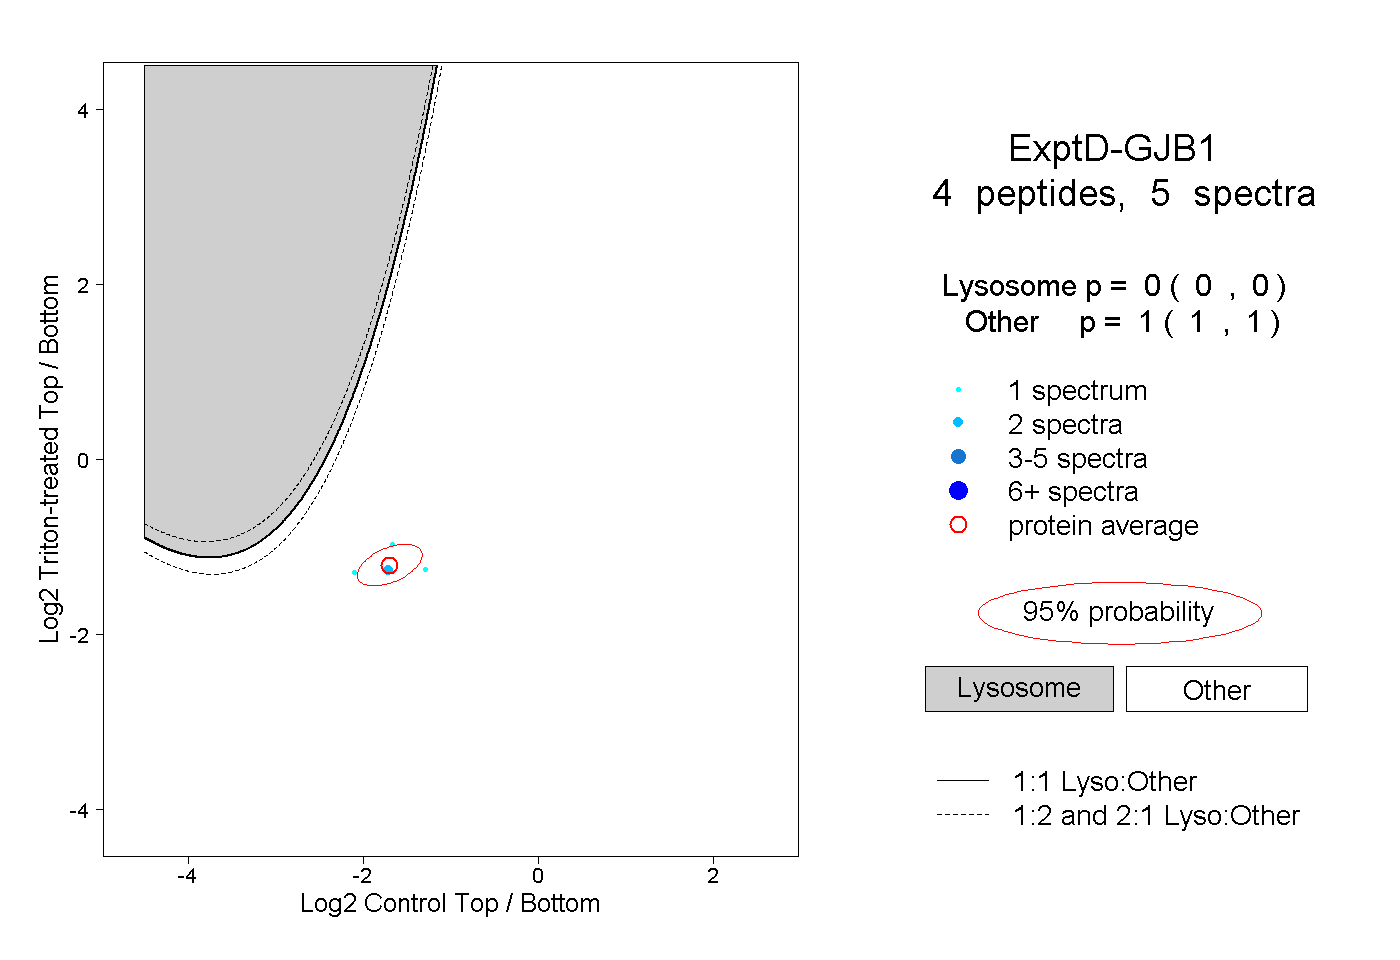 |
0.000 0.000 | 0.000 |
1.000 1.000 | 1.000 |