 5
5peptides
spectra
0.000 | 0.000
0.565 | 0.731
0.000 | 0.142
0.000 | 0.000
0.000 | 0.000
0.195 | 0.309
0.000 | 0.060
0.000 | 0.000
4peptides
spectra
0.000 | 0.000
1.000 | 1.000
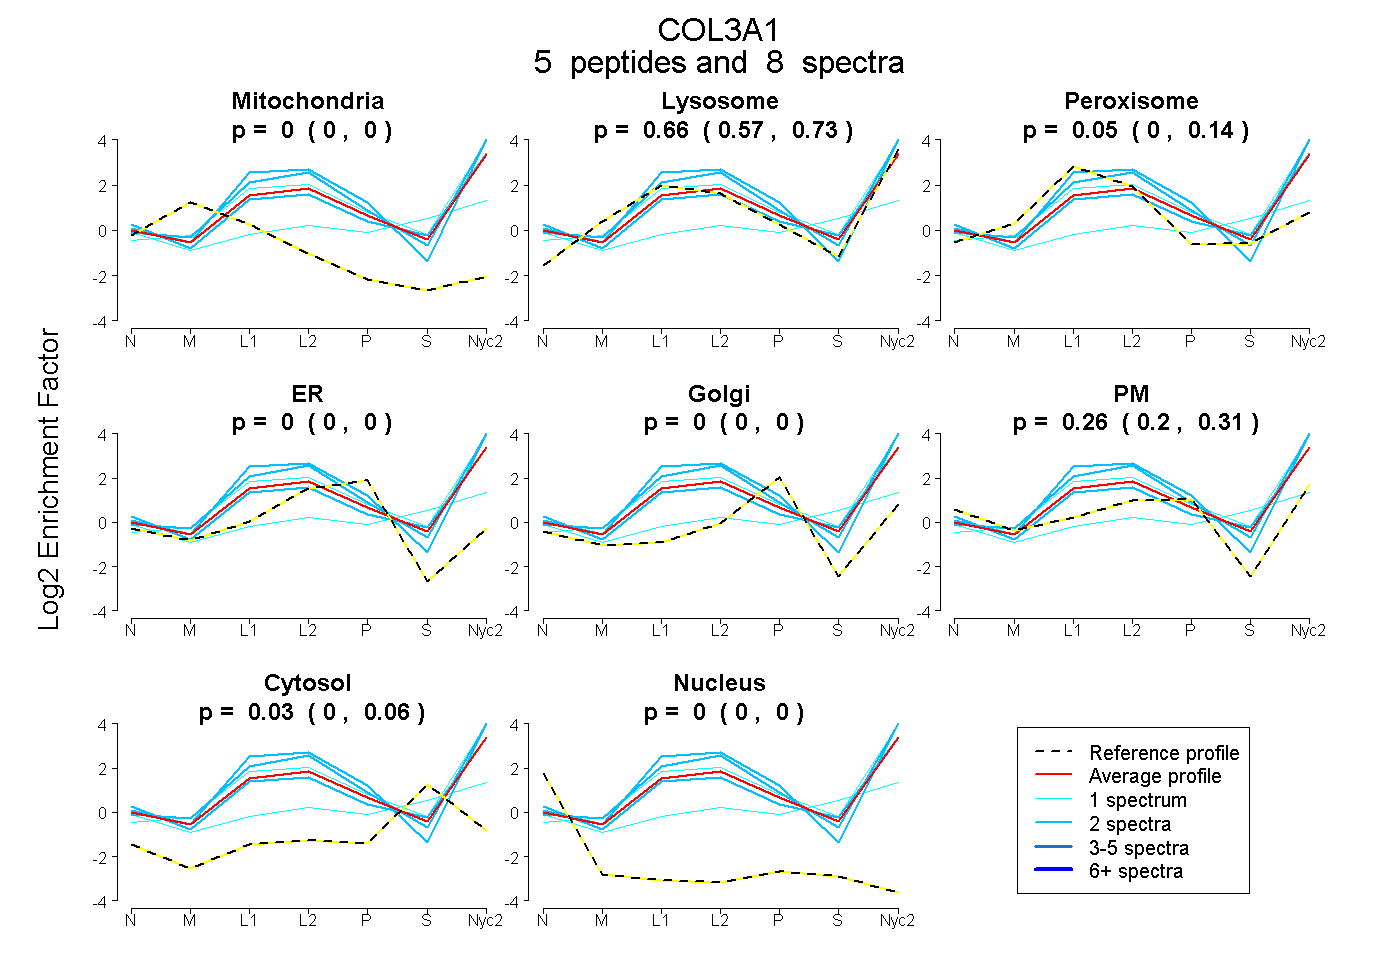
| Plot | Mito | Lyso | Perox | ER | Golgi | PM | Cytosol | Nucleus | |||||
| Expt A |
5 peptides |
8 spectra |
|
0.000 0.000 | 0.000 |
0.664 0.565 | 0.731 |
0.047 0.000 | 0.142 |
0.000 0.000 | 0.000 |
0.000 0.000 | 0.000 |
0.260 0.195 | 0.309 |
0.029 0.000 | 0.060 |
0.000 0.000 | 0.000 |
||
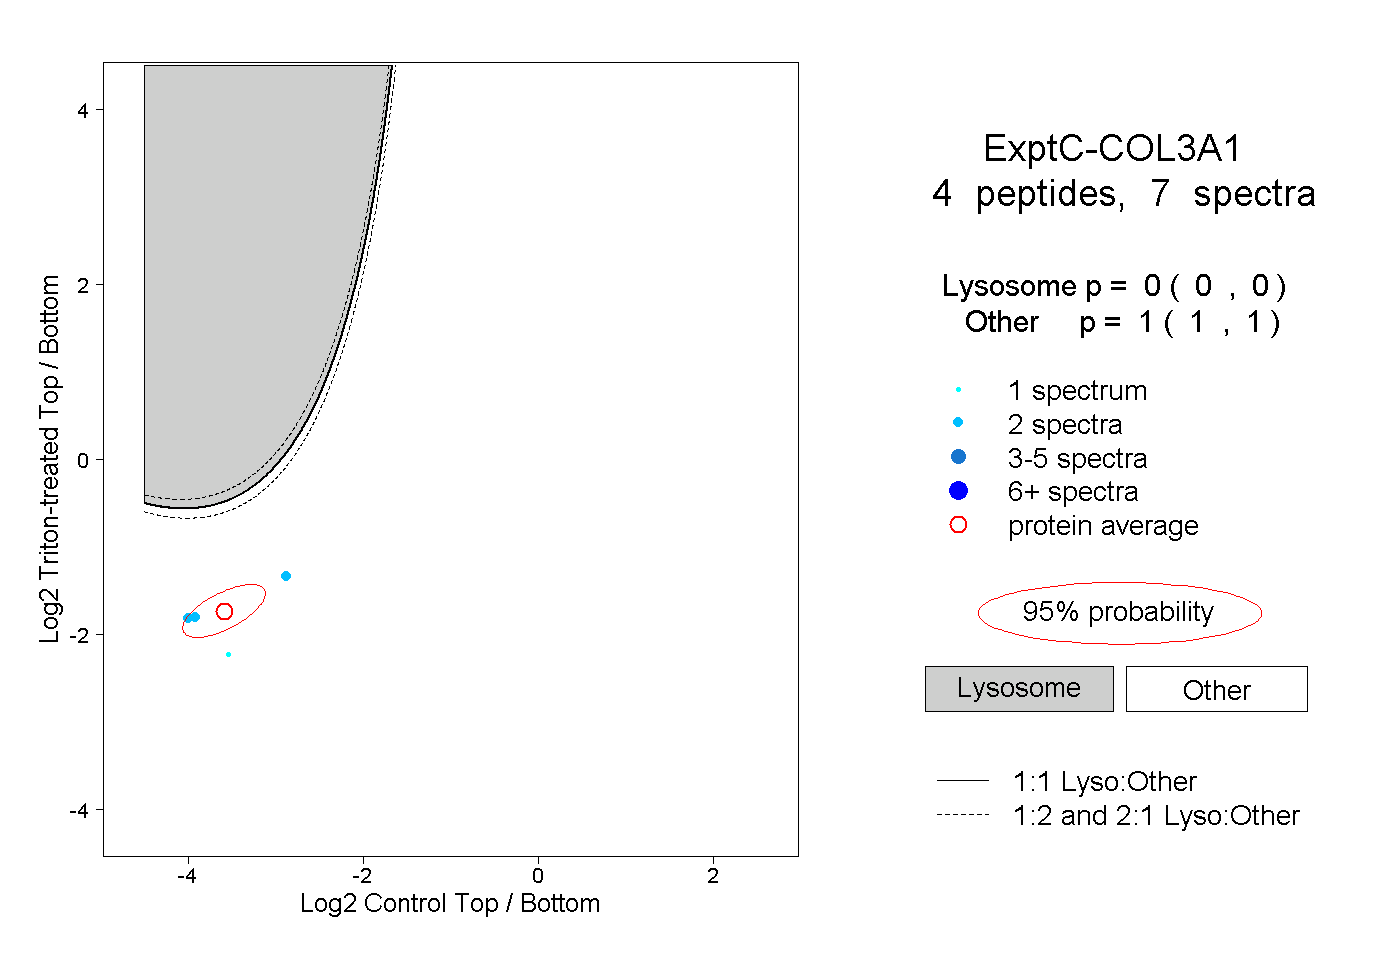
| Plot | Lyso | Other | |||||||||||
| Expt C |
4 peptides |
7 spectra |
|
0.000 0.000 | 0.000 |
1.000 1.000 | 1.000 |