 2
2peptides
spectra
0.000 | 0.069
0.000 | 0.000
0.000 | 0.087
0.125 | 0.219
0.000 | 0.000
0.000 | 0.000
0.479 | 0.569
0.205 | 0.290
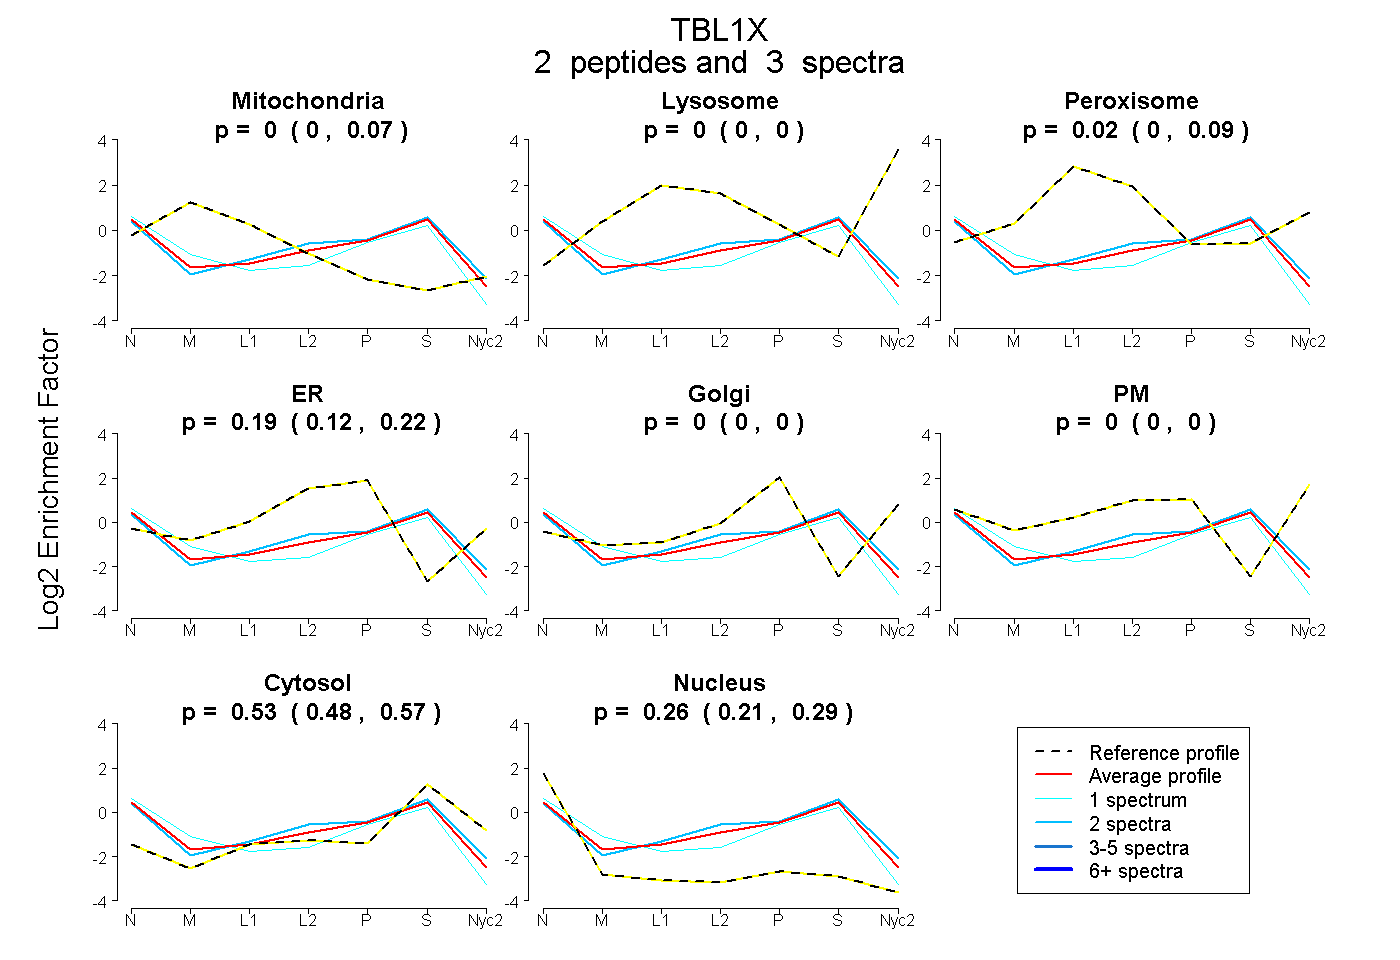
| Plot | Mito | Lyso | Perox | ER | Golgi | PM | Cytosol | Nucleus | |||||
| Expt A |
2 peptides |
3 spectra |
|
0.000 0.000 | 0.069 |
0.000 0.000 | 0.000 |
0.023 0.000 | 0.087 |
0.188 0.125 | 0.219 |
0.000 0.000 | 0.000 |
0.000 0.000 | 0.000 |
0.533 0.479 | 0.569 |
0.255 0.205 | 0.290 |