 3
3peptides
spectra
0.000 | 0.036
0.000 | 0.000
0.000 | 0.000
0.173 | 0.218
0.000 | 0.000
0.000 | 0.000
0.127 | 0.168
0.614 | 0.666
1peptide
spectrum
NA | NA
NA | NA
NA | NA
NA | NA
NA | NA
NA | NA
NA | NA
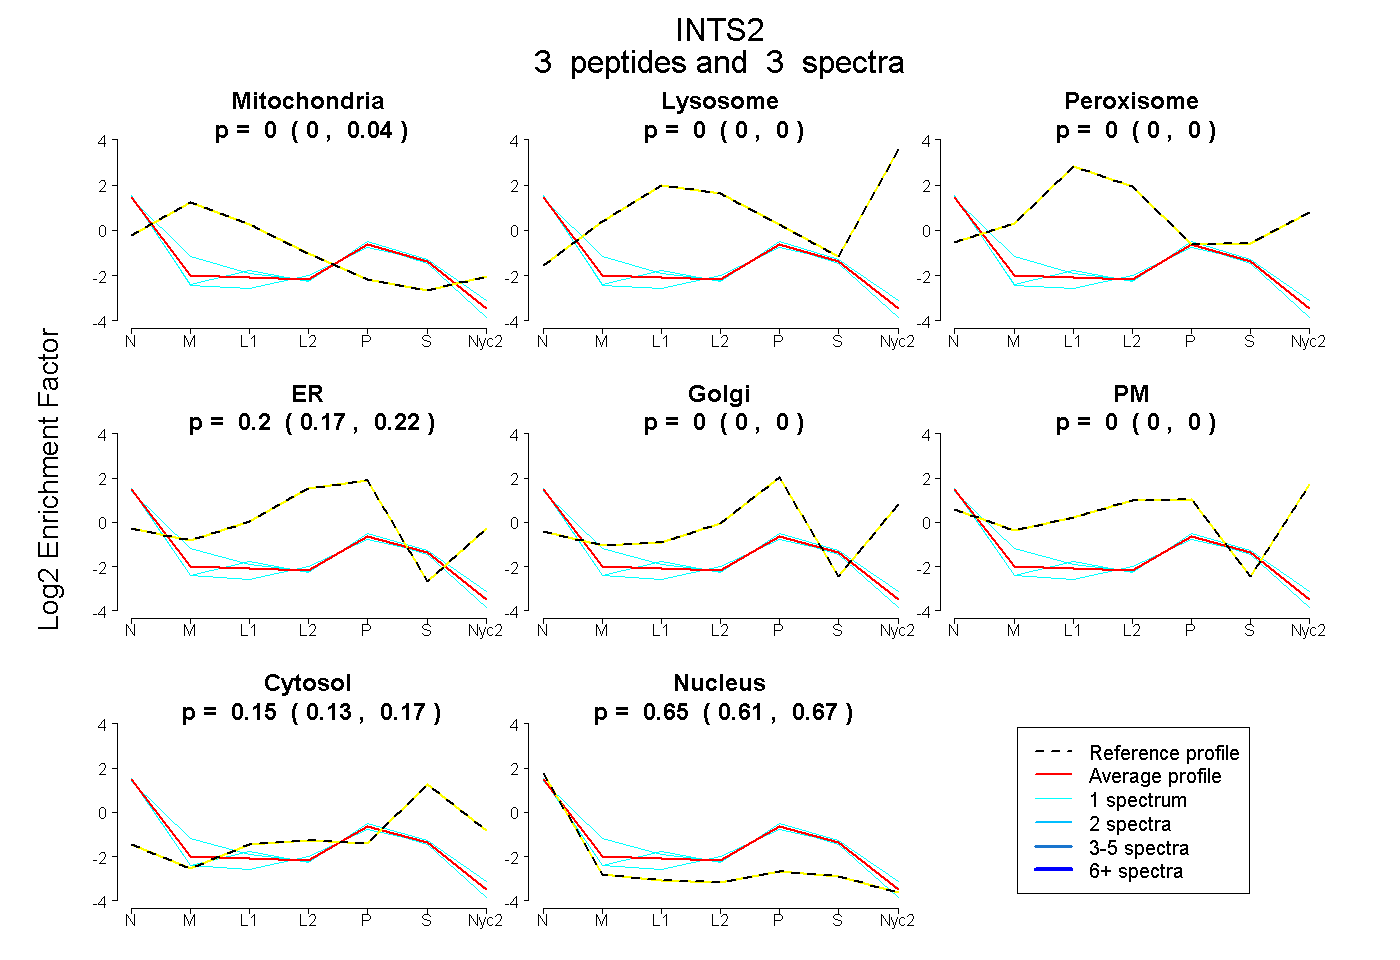
| Plot | Mito | Lyso | Perox | ER | Golgi | PM | Cytosol | Nucleus | |||||
| Expt A |
3 peptides |
3 spectra |
|
0.000 0.000 | 0.036 |
0.000 0.000 | 0.000 |
0.000 0.000 | 0.000 |
0.202 0.173 | 0.218 |
0.000 0.000 | 0.000 |
0.000 0.000 | 0.000 |
0.151 0.127 | 0.168 |
0.647 0.614 | 0.666 |
||
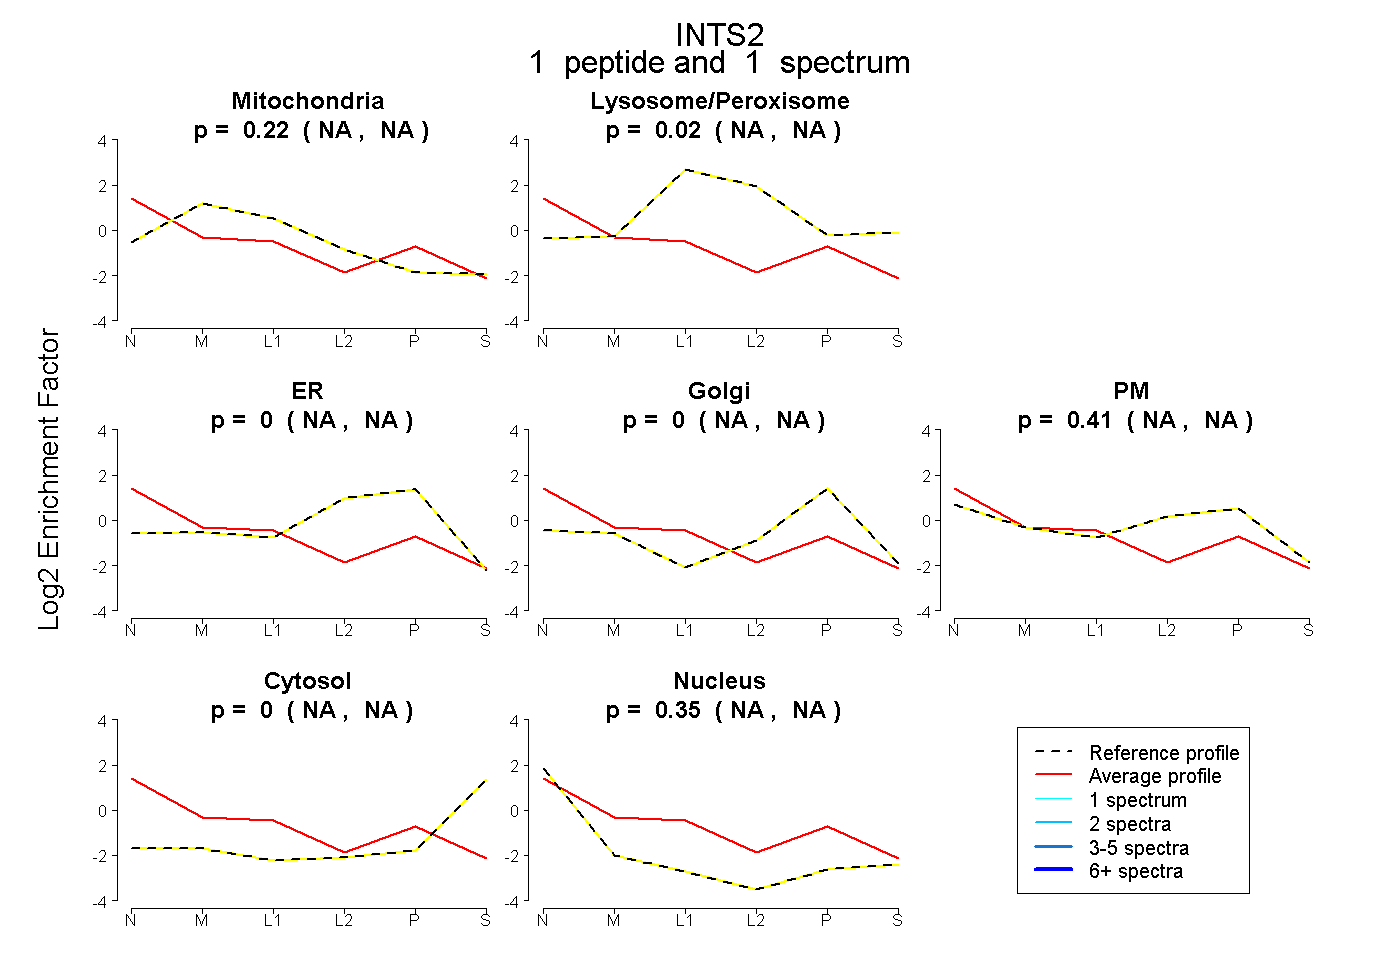
| Plot | Mito | Lyso or Perox | ER | Golgi | PM | Cytosol | Nucleus | ||||||
| Expt B |
1 peptide |
1 spectrum |
|
0.224 NA | NA |
0.020 NA | NA |
0.000 NA | NA |
0.000 NA | NA |
0.409 NA | NA |
0.000 NA | NA |
0.347 NA | NA |