 28
28peptides
spectra
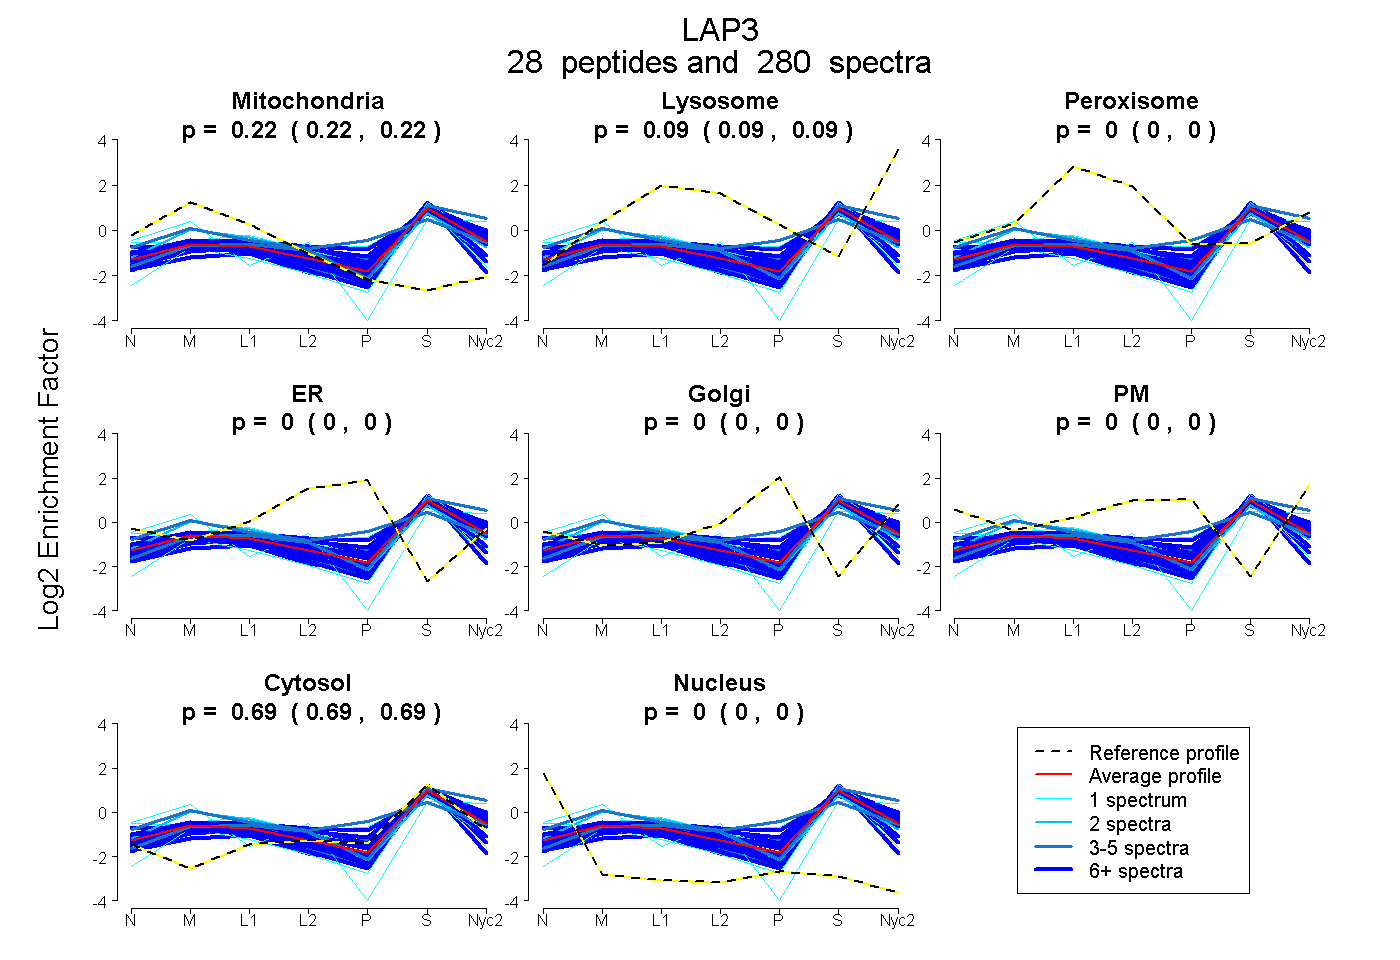
0.216 | 0.219
0.085 | 0.091
0.000 | 0.005
0.000 | 0.000
0.000 | 0.000
0.000 | 0.000
0.691 | 0.692
0.000 | 0.000
21peptides
spectra
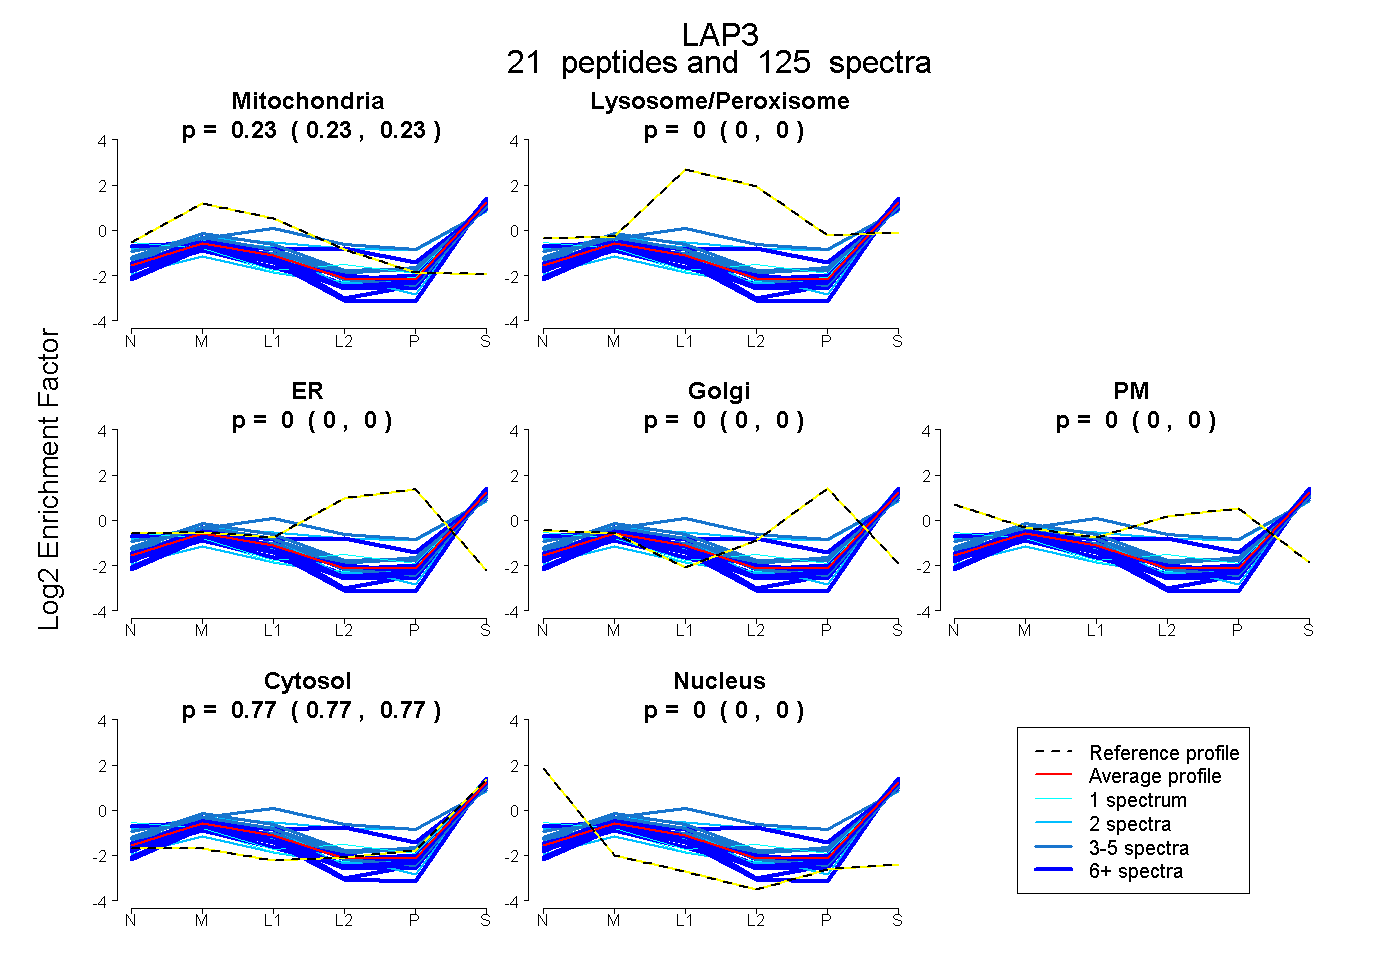
0.227 | 0.231
0.000 | 0.000
0.000 | 0.000
0.000 | 0.000
0.000 | 0.000
0.769 | 0.773
0.000 | 0.000
26peptides
spectra
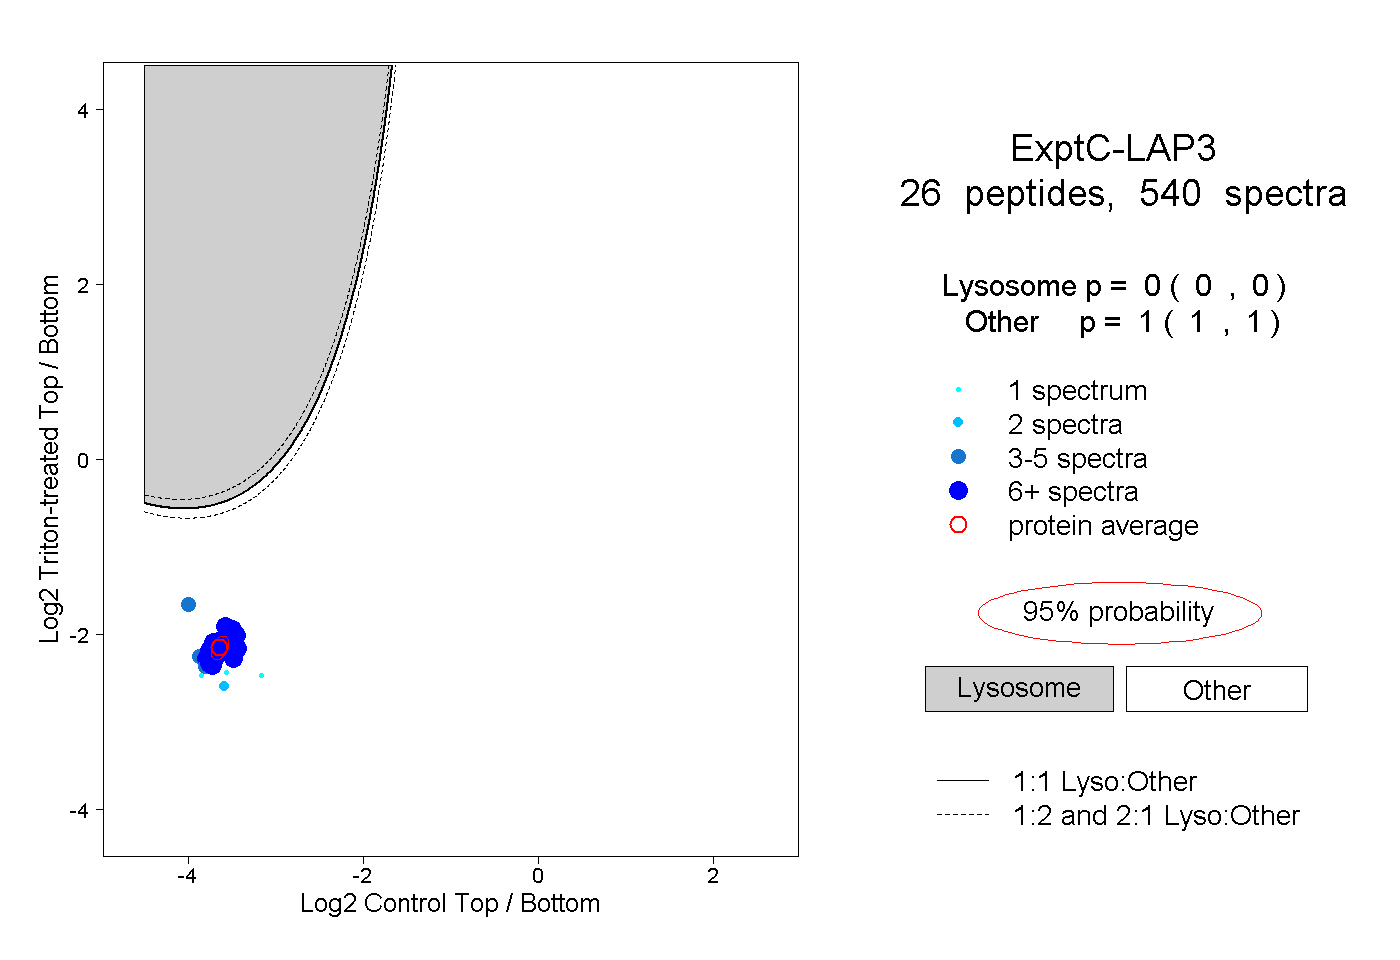
0.000 | 0.000
1.000 | 1.000
15peptides
spectra
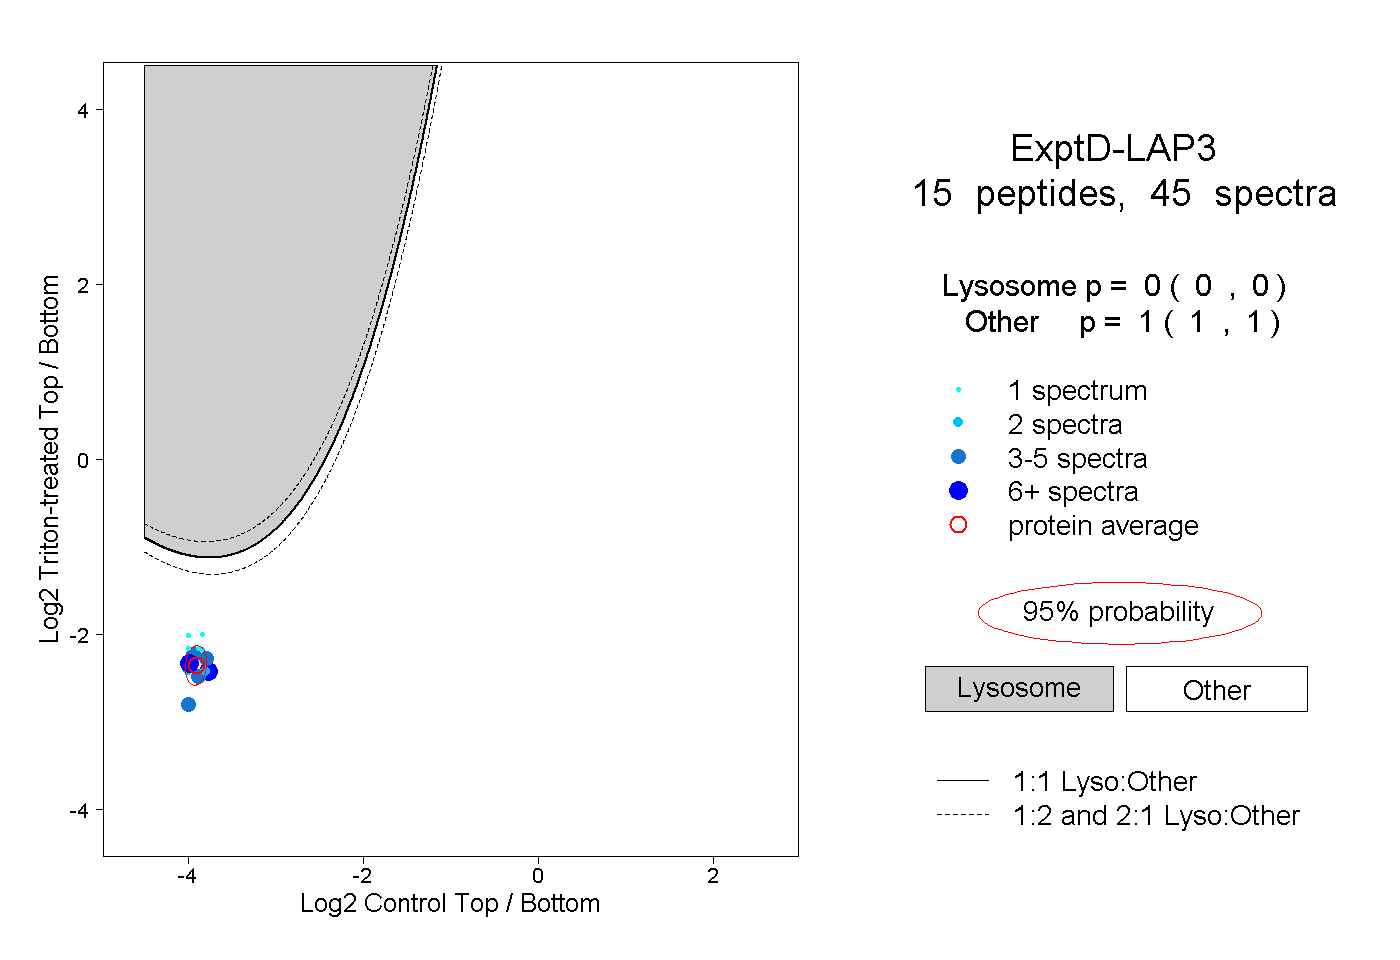
0.000 | 0.000
1.000 | 1.000