 2
2peptides
spectra
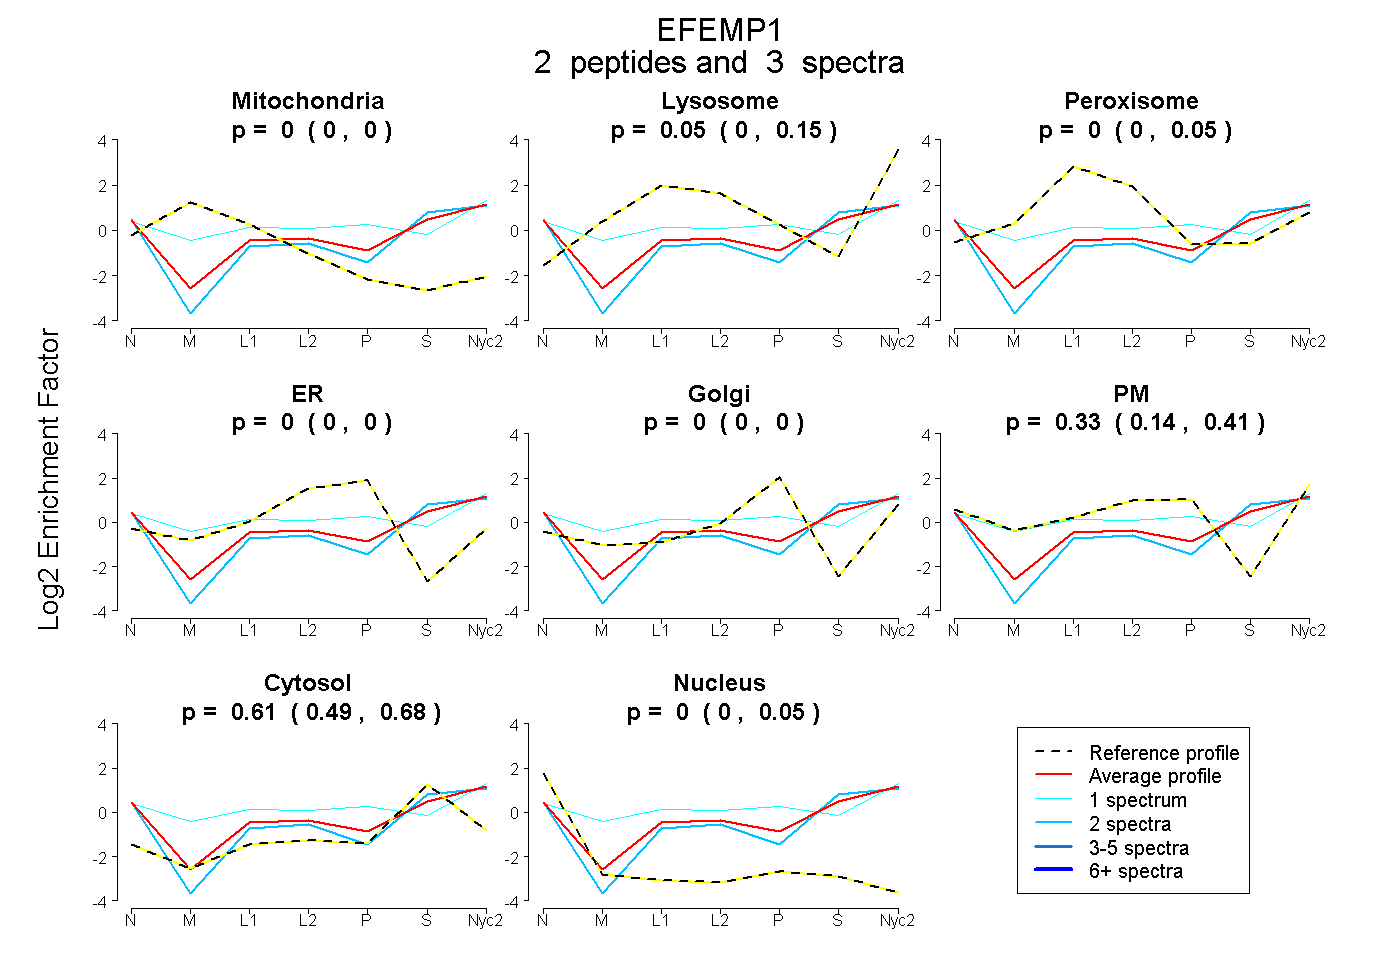
0.000 | 0.000
0.000 | 0.148
0.000 | 0.054
0.000 | 0.000
0.000 | 0.000
0.142 | 0.409
0.491 | 0.682
0.000 | 0.052
| Plot | Mito | Lyso | Perox | ER | Golgi | PM | Cytosol | Nucleus | |||||
| Expt A |
2 peptides |
3 spectra |
|
0.000 0.000 | 0.000 |
0.053 0.000 | 0.148 |
0.000 0.000 | 0.054 |
0.000 0.000 | 0.000 |
0.000 0.000 | 0.000 |
0.335 0.142 | 0.409 |
0.613 0.491 | 0.682 |
0.000 0.000 | 0.052 |
| 1 spectrum, FSCMCPQGYQVVR | 0.000 | 0.102 | 0.098 | 0.000 | 0.000 | 0.488 | 0.313 | 0.000 | ||
| 2 spectra, LNCEDIDECR | 0.000 | 0.000 | 0.000 | 0.000 | 0.000 | 0.246 | 0.754 | 0.000 |
| Plot | Lyso | Other | |||||||||||
| Expt C |
4 peptides |
10 spectra |
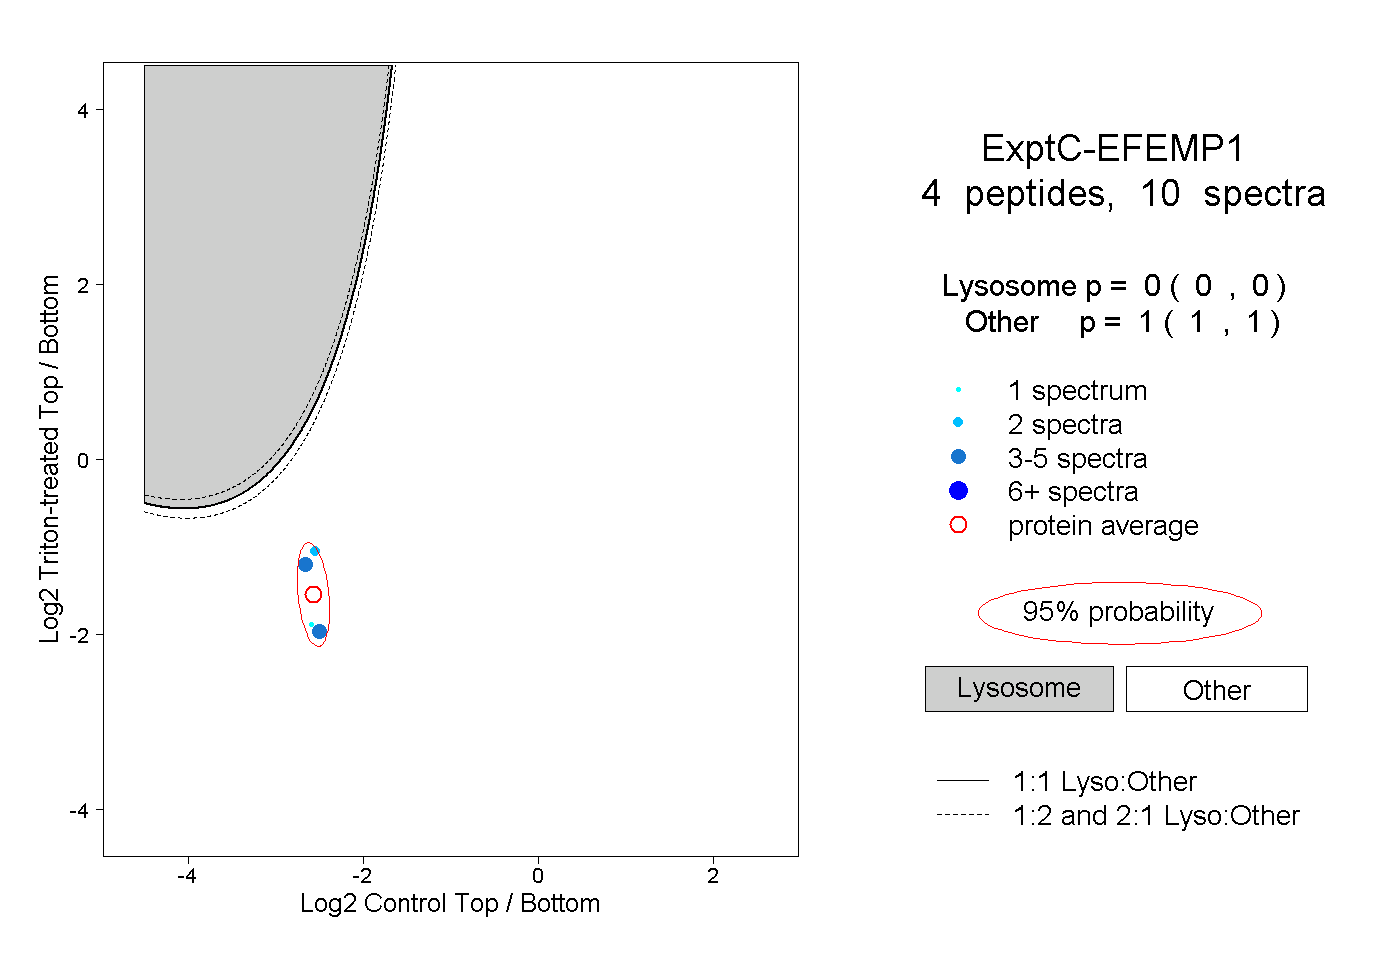 |
0.000 0.000 | 0.000 |
1.000 1.000 | 1.000 |