 2
2peptides
spectra
NA | NA
NA | NA
NA | NA
NA | NA
NA | NA
NA | NA
NA | NA
NA | NA
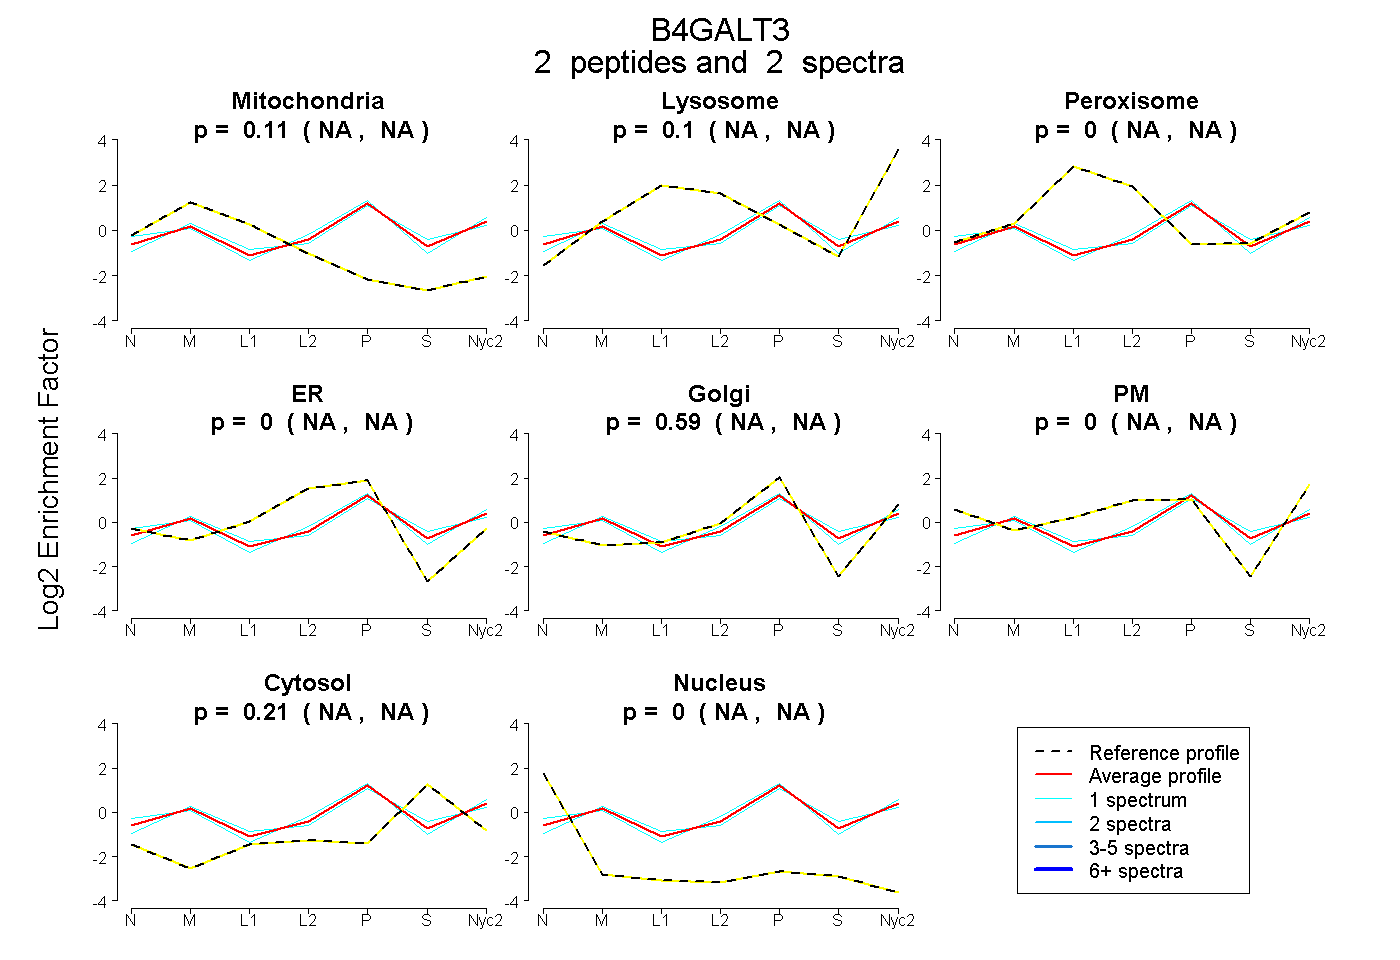
| Plot | Mito | Lyso | Perox | ER | Golgi | PM | Cytosol | Nucleus | |||||
| Expt A |
2 peptides |
2 spectra |
|
0.106 NA | NA |
0.099 NA | NA |
0.000 NA | NA |
0.000 NA | NA |
0.586 NA | NA |
0.000 NA | NA |
0.210 NA | NA |
0.000 NA | NA |
| 1 spectrum, FDLLVR | 0.078 | 0.046 | 0.000 | 0.000 | 0.638 | 0.071 | 0.167 | 0.000 | ||
| 1 spectrum, APSGPR | 0.124 | 0.129 | 0.000 | 0.000 | 0.485 | 0.000 | 0.262 | 0.000 |