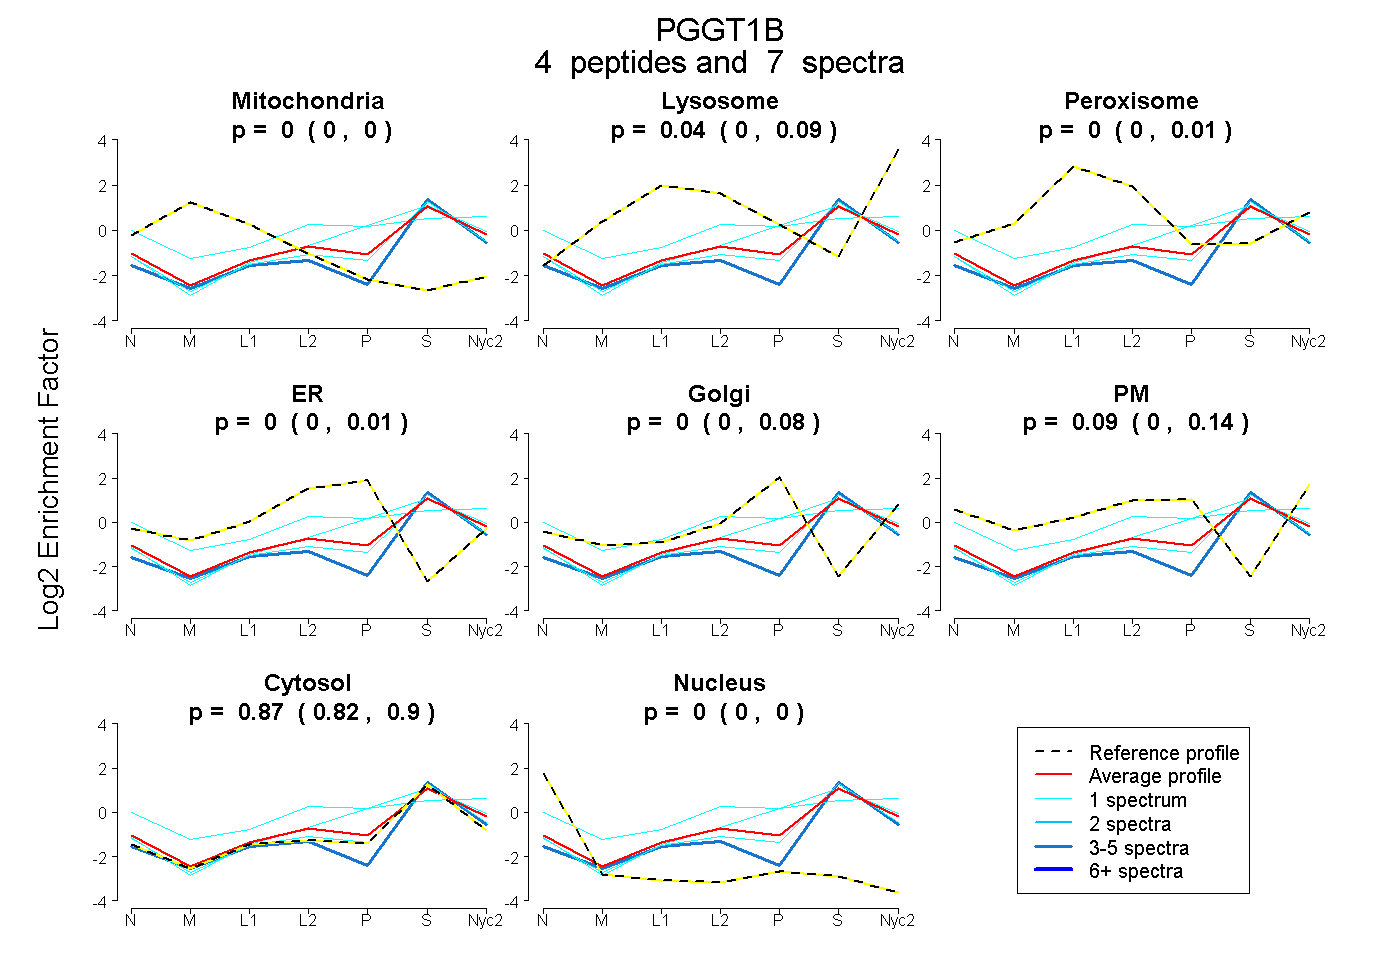
 4
4peptides
spectra
0.000 | 0.000
0.000 | 0.092
0.000 | 0.010
0.000 | 0.007
0.000 | 0.083
0.000 | 0.141
0.816 | 0.899
0.000 | 0.000
| Plot | Mito | Lyso | Perox | ER | Golgi | PM | Cytosol | Nucleus | |||||
| Expt A |
4 peptides |
7 spectra |
|
0.000 0.000 | 0.000 |
0.039 0.000 | 0.092 |
0.000 0.000 | 0.010 |
0.000 0.000 | 0.007 |
0.000 0.000 | 0.083 |
0.093 0.000 | 0.141 |
0.868 0.816 | 0.899 |
0.000 0.000 | 0.000 |
| 1 spectrum, VHPALNVSTR | 0.000 | 0.030 | 0.039 | 0.000 | 0.000 | 0.417 | 0.514 | 0.000 | ||
| 1 spectrum, LVGGFAK | 0.000 | 0.000 | 0.000 | 0.000 | 0.000 | 0.031 | 0.969 | 0.000 | ||
| 1 spectrum, YSSLETSR | 0.000 | 0.000 | 0.000 | 0.000 | 0.236 | 0.000 | 0.764 | 0.000 | ||
| 4 spectra, LEEVFSEK | 0.000 | 0.000 | 0.000 | 0.000 | 0.000 | 0.000 | 1.000 | 0.000 |
| Plot | Mito | Lyso or Perox | ER | Golgi | PM | Cytosol | Nucleus | ||||||
| Expt B |
1 peptide |
1 spectrum |
 |
0.033 NA | NA |
0.189 NA | NA |
0.000 NA | NA |
0.000 NA | NA |
0.050 NA | NA |
0.728 NA | NA |
0.000 NA | NA |
|||
| Plot | Lyso | Other | |||||||||||
| Expt C |
1 peptide |
1 spectrum |
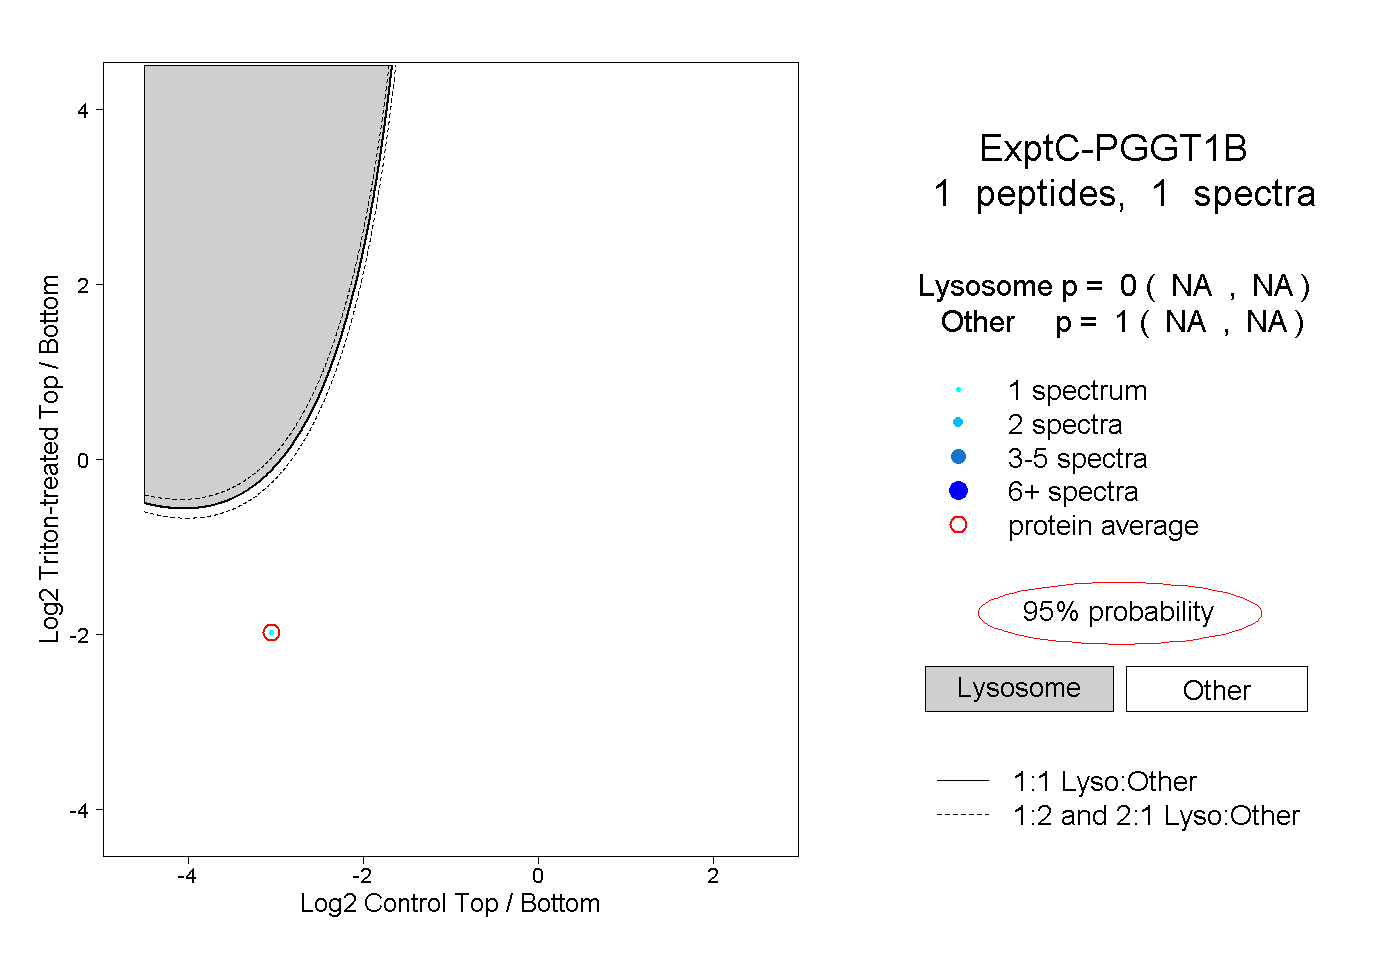 |
0.000 NA | NA |
1.000 NA | NA |