 12
12peptides
spectra
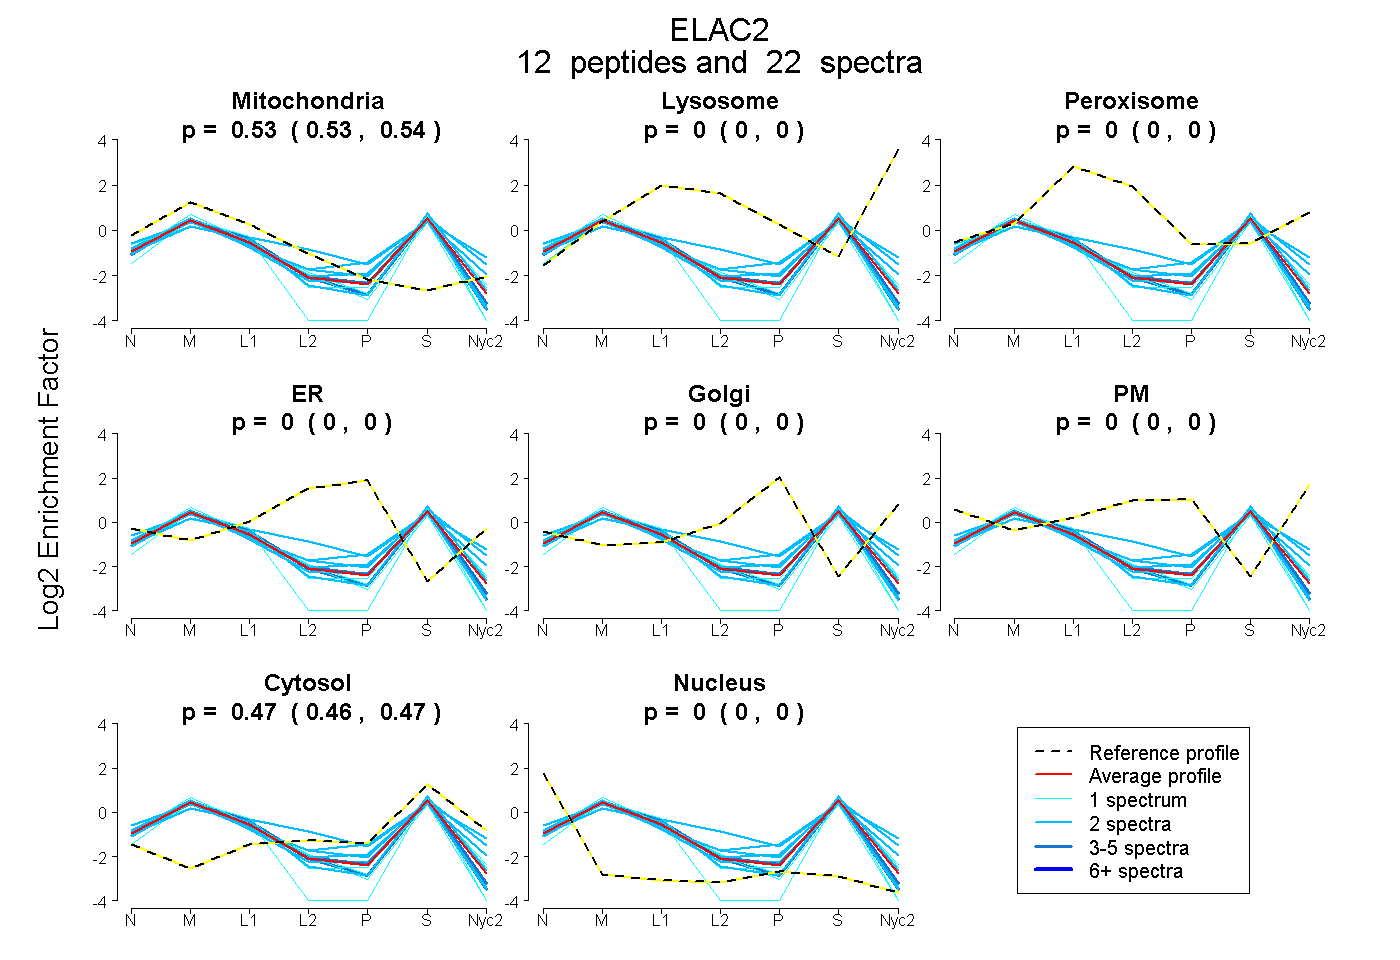
0.527 | 0.536
0.000 | 0.000
0.000 | 0.000
0.000 | 0.000
0.000 | 0.000
0.000 | 0.000
0.461 | 0.472
0.000 | 0.005
17peptides
spectra
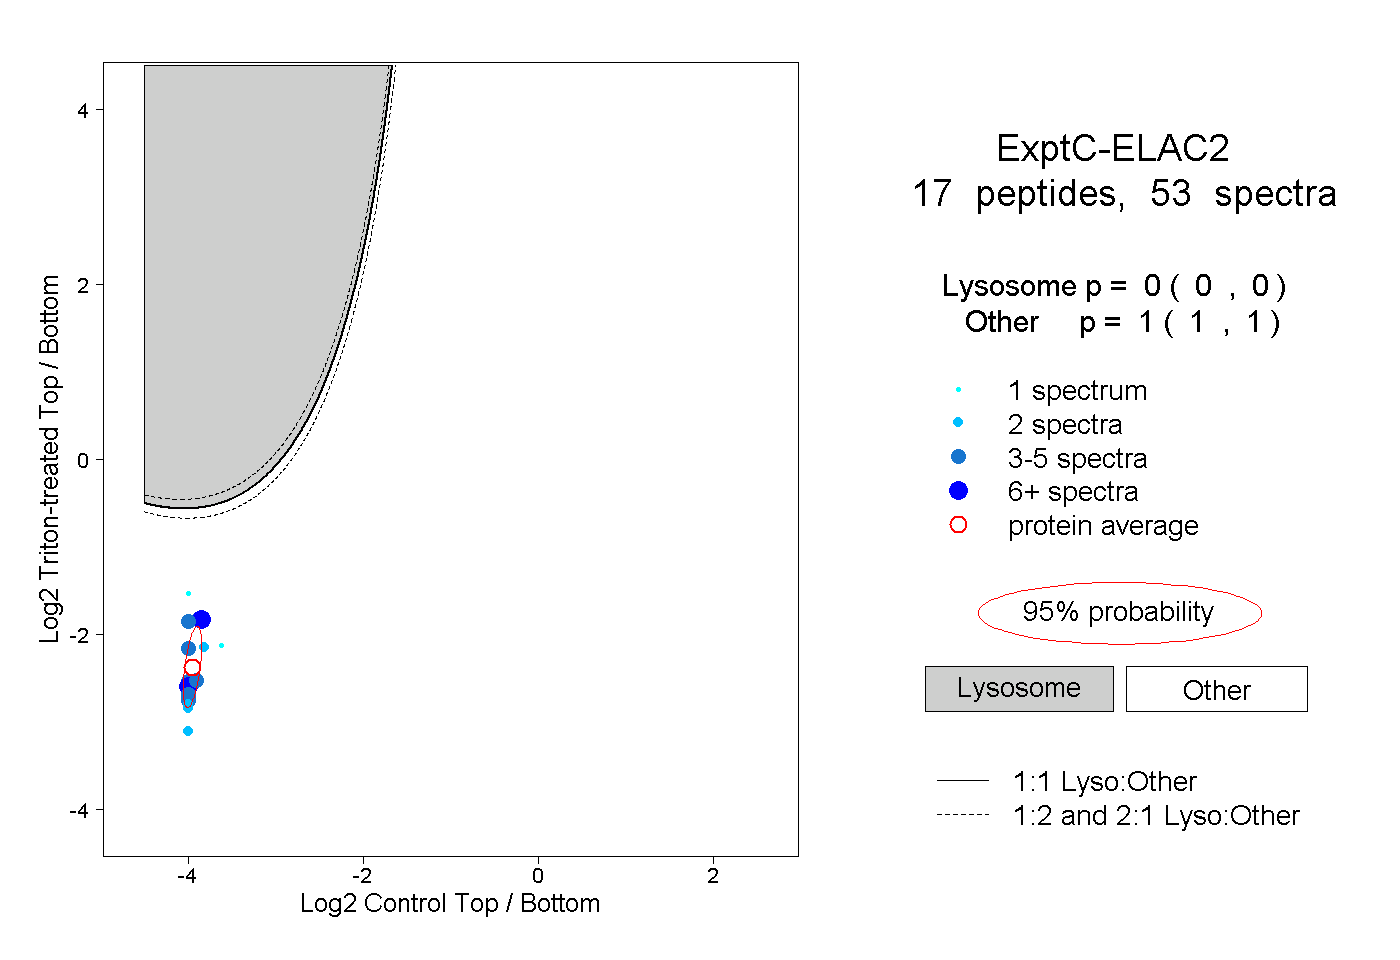
0.000 | 0.000
1.000 | 1.000
| Plot | Mito | Lyso | Perox | ER | Golgi | PM | Cytosol | Nucleus | |||||
| Expt A |
12 peptides |
22 spectra |
|
0.532 0.527 | 0.536 |
0.000 0.000 | 0.000 |
0.000 0.000 | 0.000 |
0.000 0.000 | 0.000 |
0.000 0.000 | 0.000 |
0.000 0.000 | 0.000 |
0.468 0.461 | 0.472 |
0.000 0.000 | 0.005 |
||
| Plot | Lyso | Other | |||||||||||
| Expt C |
17 peptides |
53 spectra |
|
0.000 0.000 | 0.000 |
1.000 1.000 | 1.000 |
| 4 spectra, ALFADDIEEMVER | 0.000 | 1.000 | ||||||||
| 6 spectra, ILPPLK | 0.000 | 1.000 | ||||||||
| 6 spectra, IFSGPLK | 0.000 | 1.000 | ||||||||
| 2 spectra, EEGSTFSLPTVR | 0.000 | 1.000 | ||||||||
| 4 spectra, ETGLPK | 0.000 | 1.000 | ||||||||
| 1 spectrum, YQQWMER | 0.000 | 1.000 | ||||||||
| 3 spectra, YLEAIK | 0.000 | 1.000 | ||||||||
| 1 spectrum, DPSLVVAFVCK | 0.000 | 1.000 | ||||||||
| 4 spectra, GNFLVLK | 0.000 | 1.000 | ||||||||
| 4 spectra, HYGQQIDR | 0.000 | 1.000 | ||||||||
| 2 spectra, YQLRPK | 0.000 | 1.000 | ||||||||
| 2 spectra, IPLFSPDFNEK | 0.000 | 1.000 | ||||||||
| 2 spectra, YLFNCGEGVQR | 0.000 | 1.000 | ||||||||
| 4 spectra, SITYEGR | 0.000 | 1.000 | ||||||||
| 3 spectra, GAEVPSPPVER | 0.000 | 1.000 | ||||||||
| 2 spectra, VGIAFDHMK | 0.000 | 1.000 | ||||||||
| 3 spectra, LDNIFLTR | 0.000 | 1.000 |
| Plot | Lyso | Other | |||||||||||
| Expt D |
4 peptides |
7 spectra |
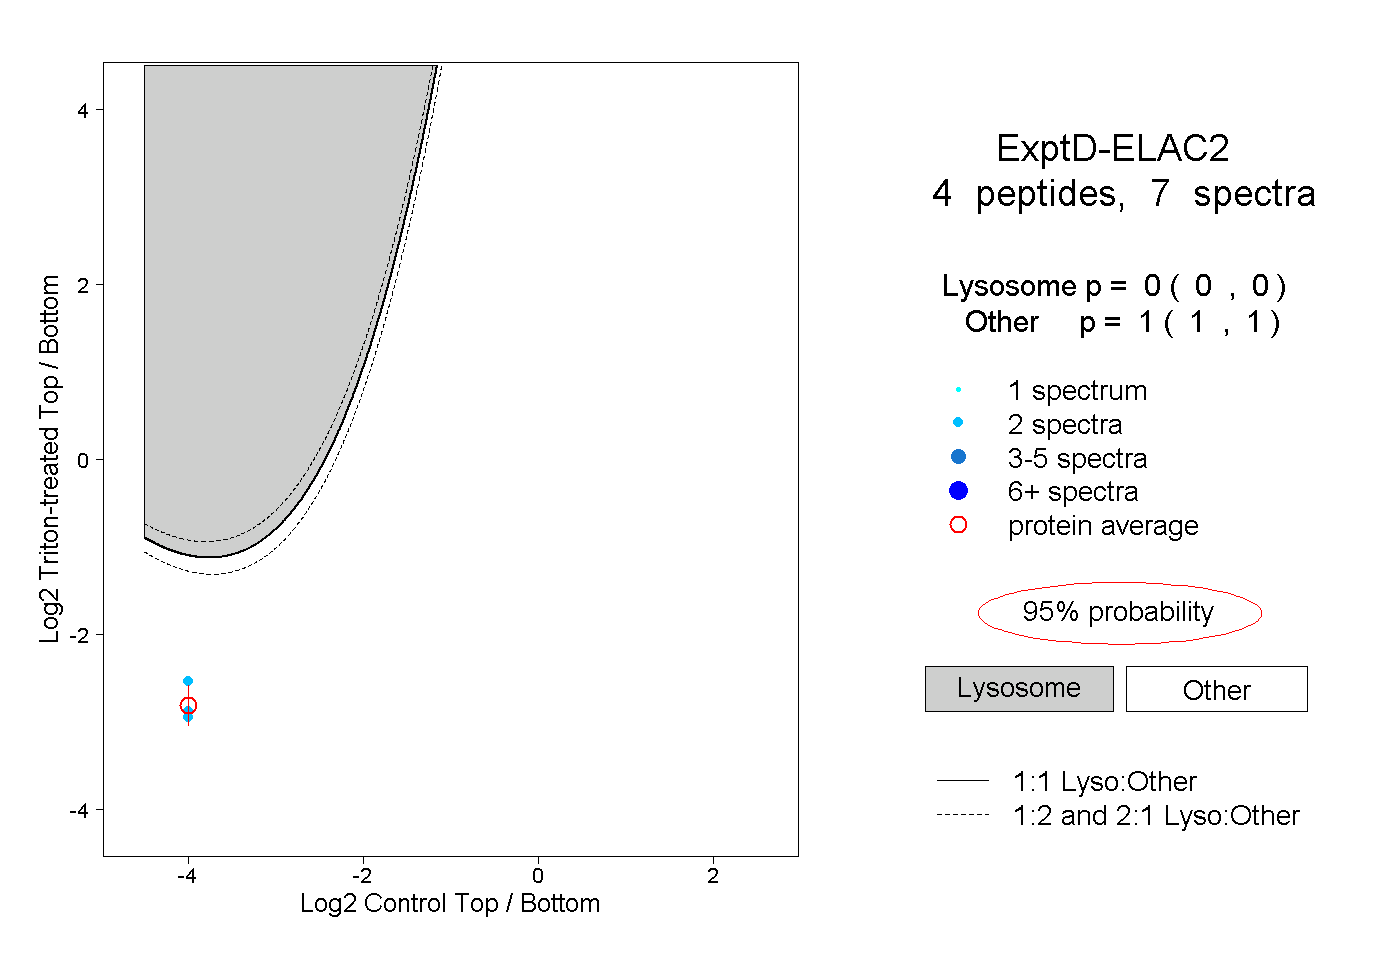 |
0.000 0.000 | 0.000 |
1.000 1.000 | 1.000 |