 18
18peptides
spectra
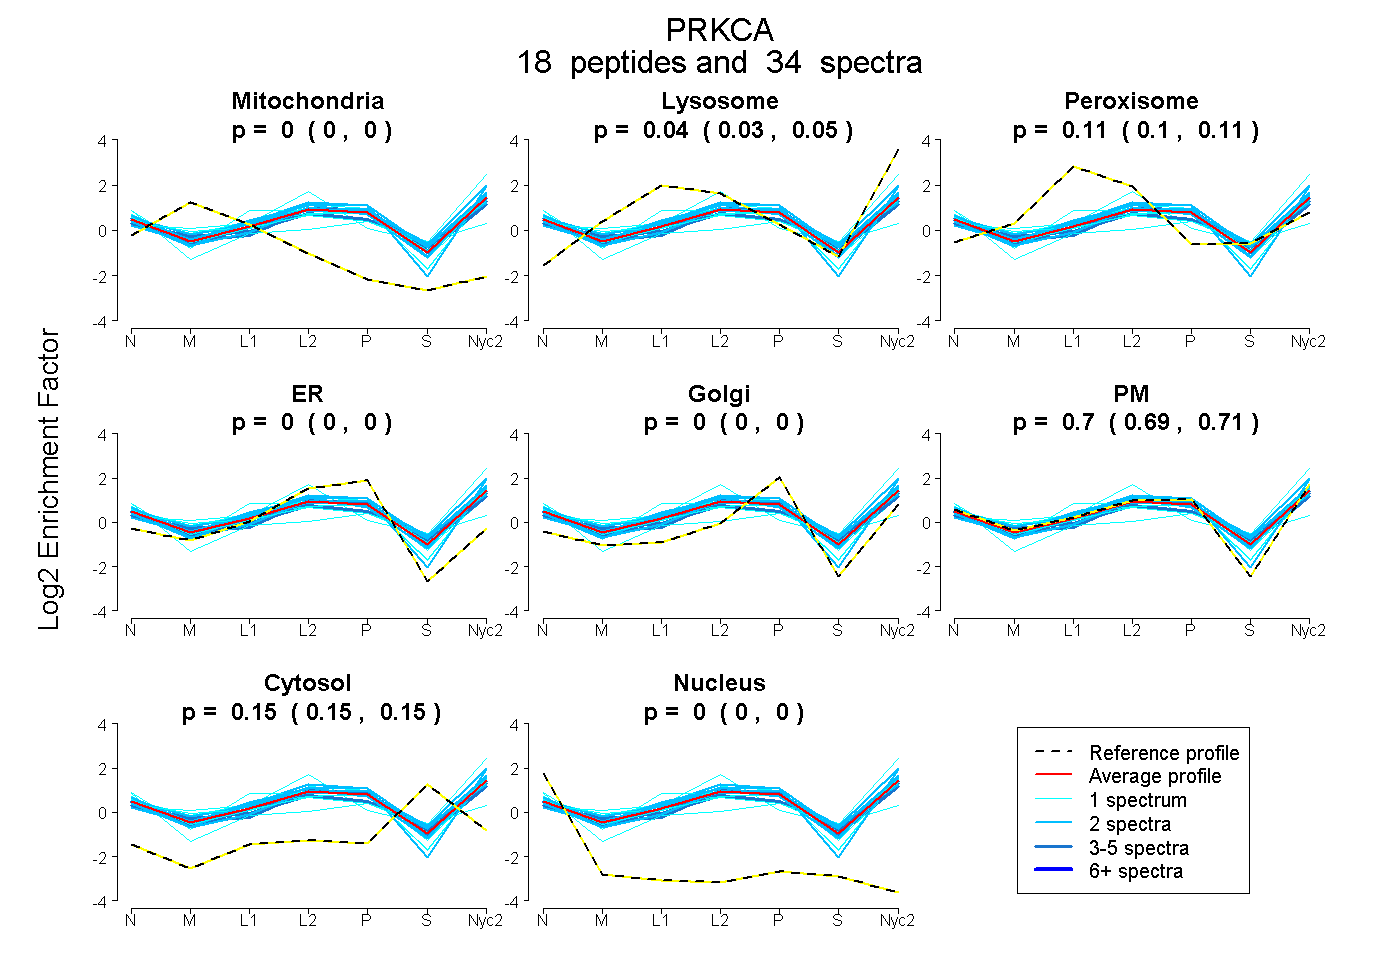
0.000 | 0.000
0.031 | 0.047
0.100 | 0.115
0.000 | 0.000
0.000 | 0.000
0.693 | 0.707
0.147 | 0.155
0.000 | 0.000
1peptide
spectra
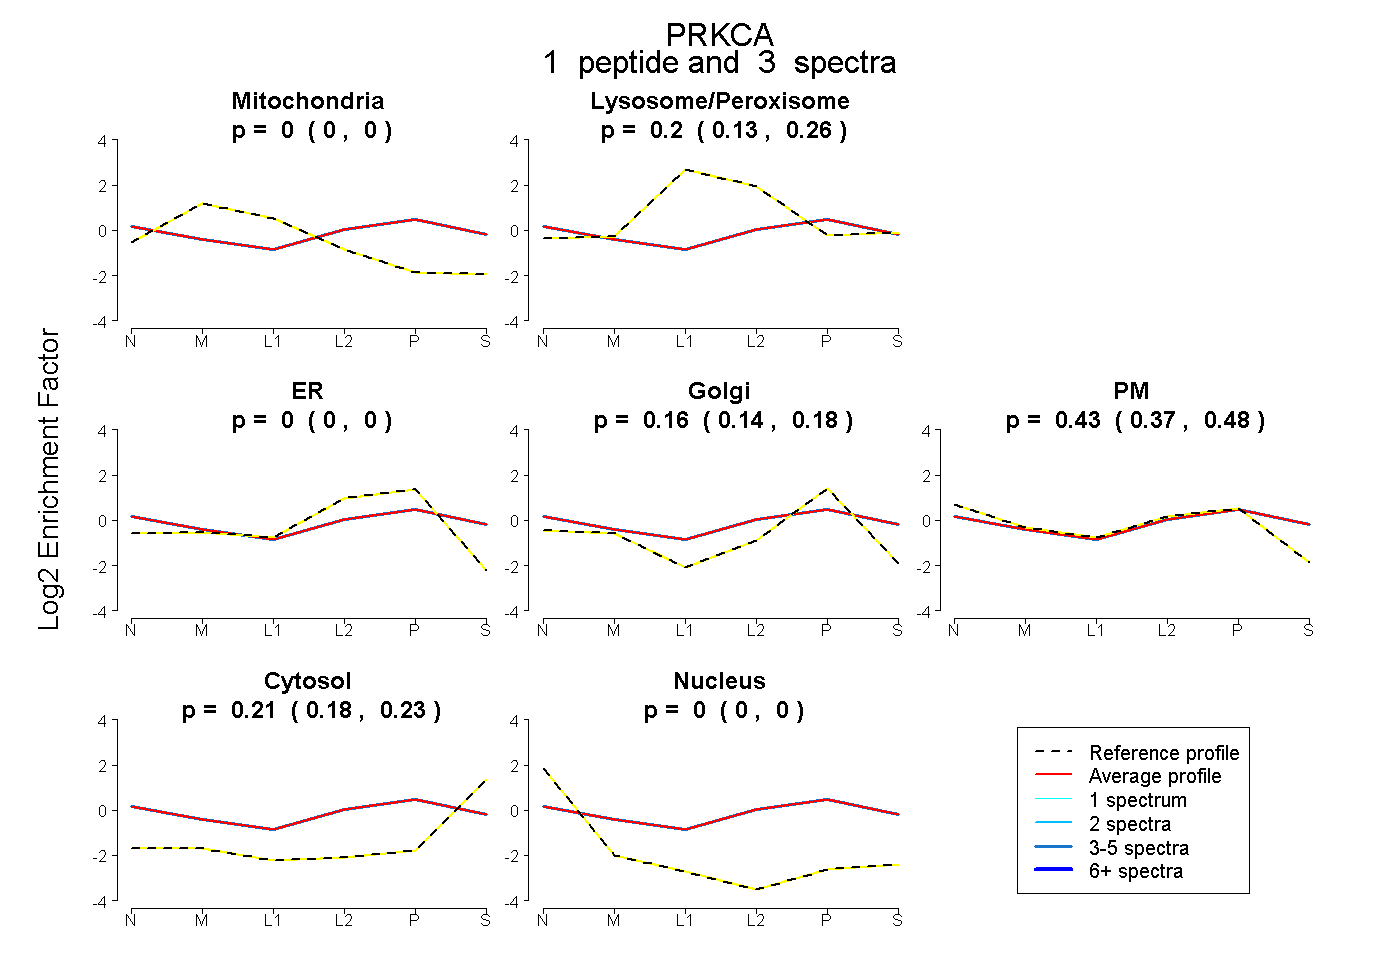
0.000 | 0.000
0.133 | 0.255
0.000 | 0.000
0.136 | 0.181
0.375 | 0.480
0.181 | 0.229
0.000 | 0.000
13peptides
spectra
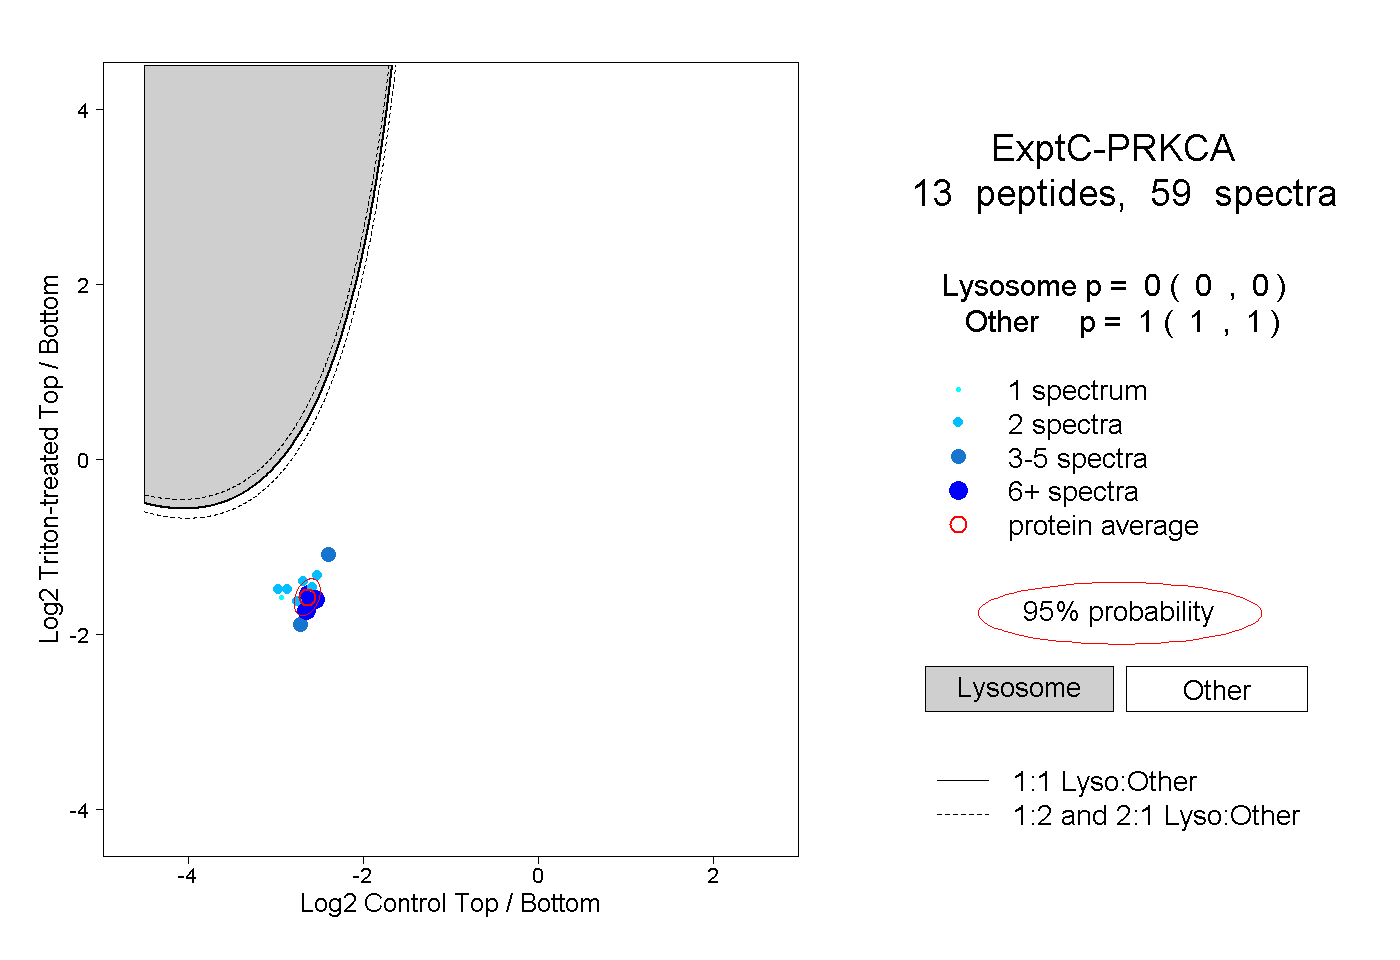
0.000 | 0.000
1.000 | 1.000
3peptides
spectra
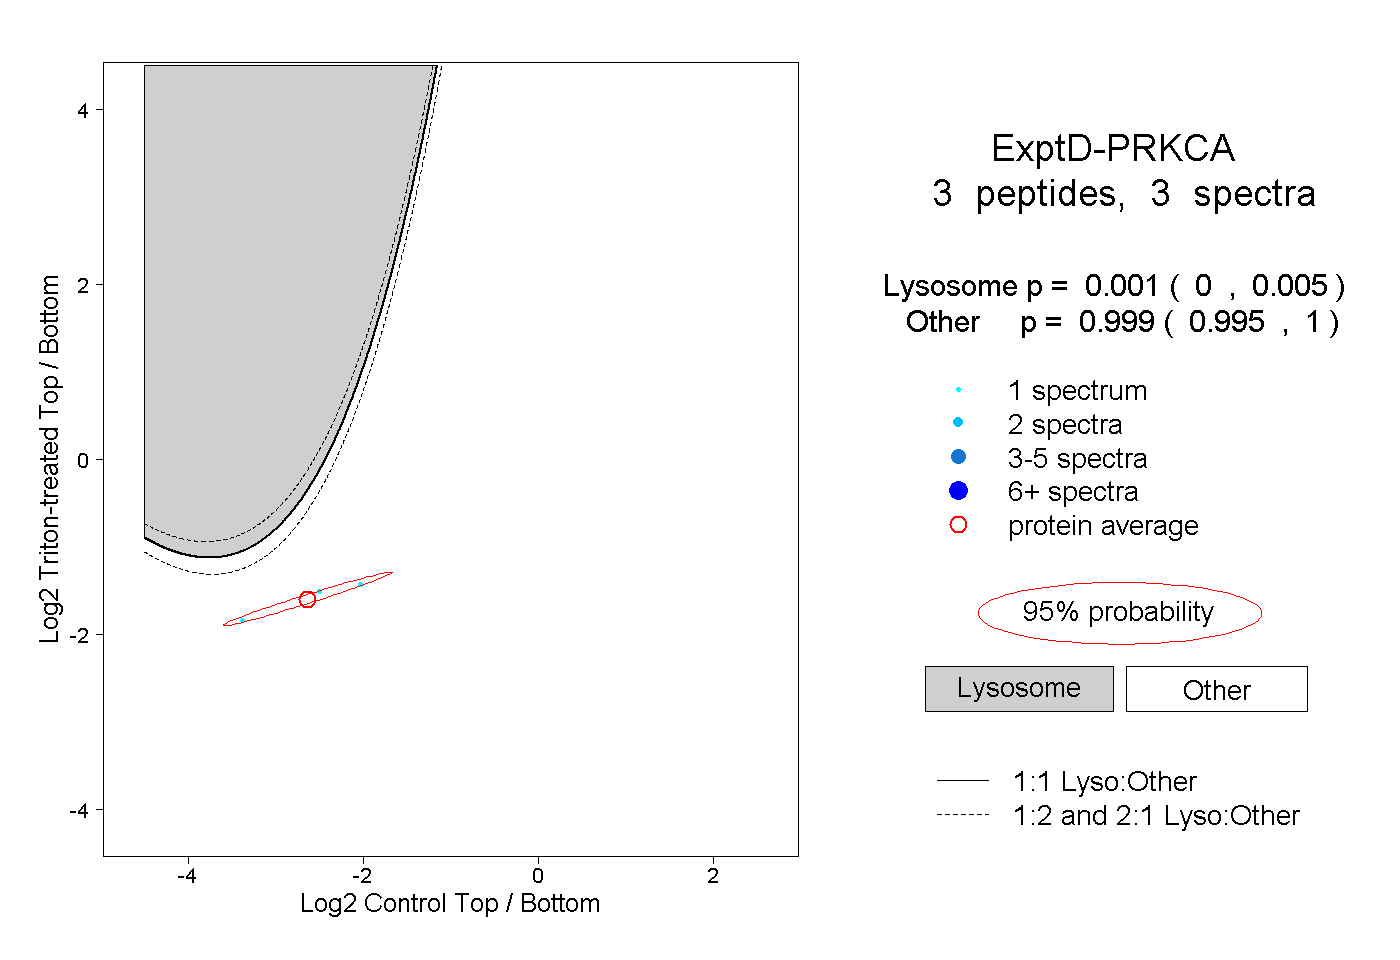
0.000 | 0.005
0.995 | 1.000