 21
21peptides
spectra
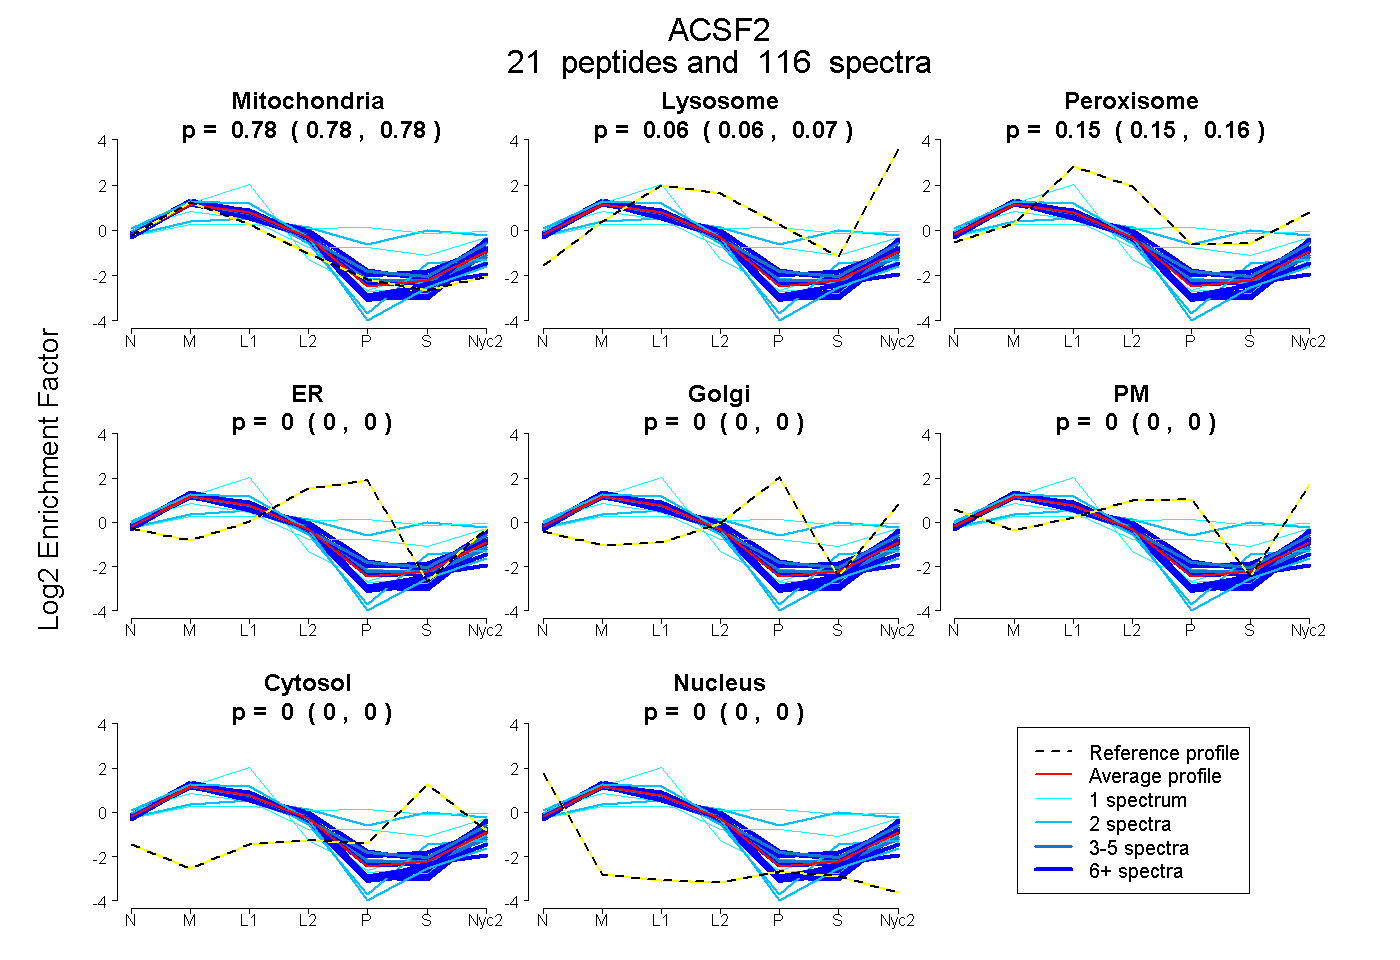
0.777 | 0.783
0.059 | 0.069
0.149 | 0.160
0.000 | 0.000
0.000 | 0.000
0.000 | 0.000
0.000 | 0.000
0.000 | 0.000
16peptides
spectra
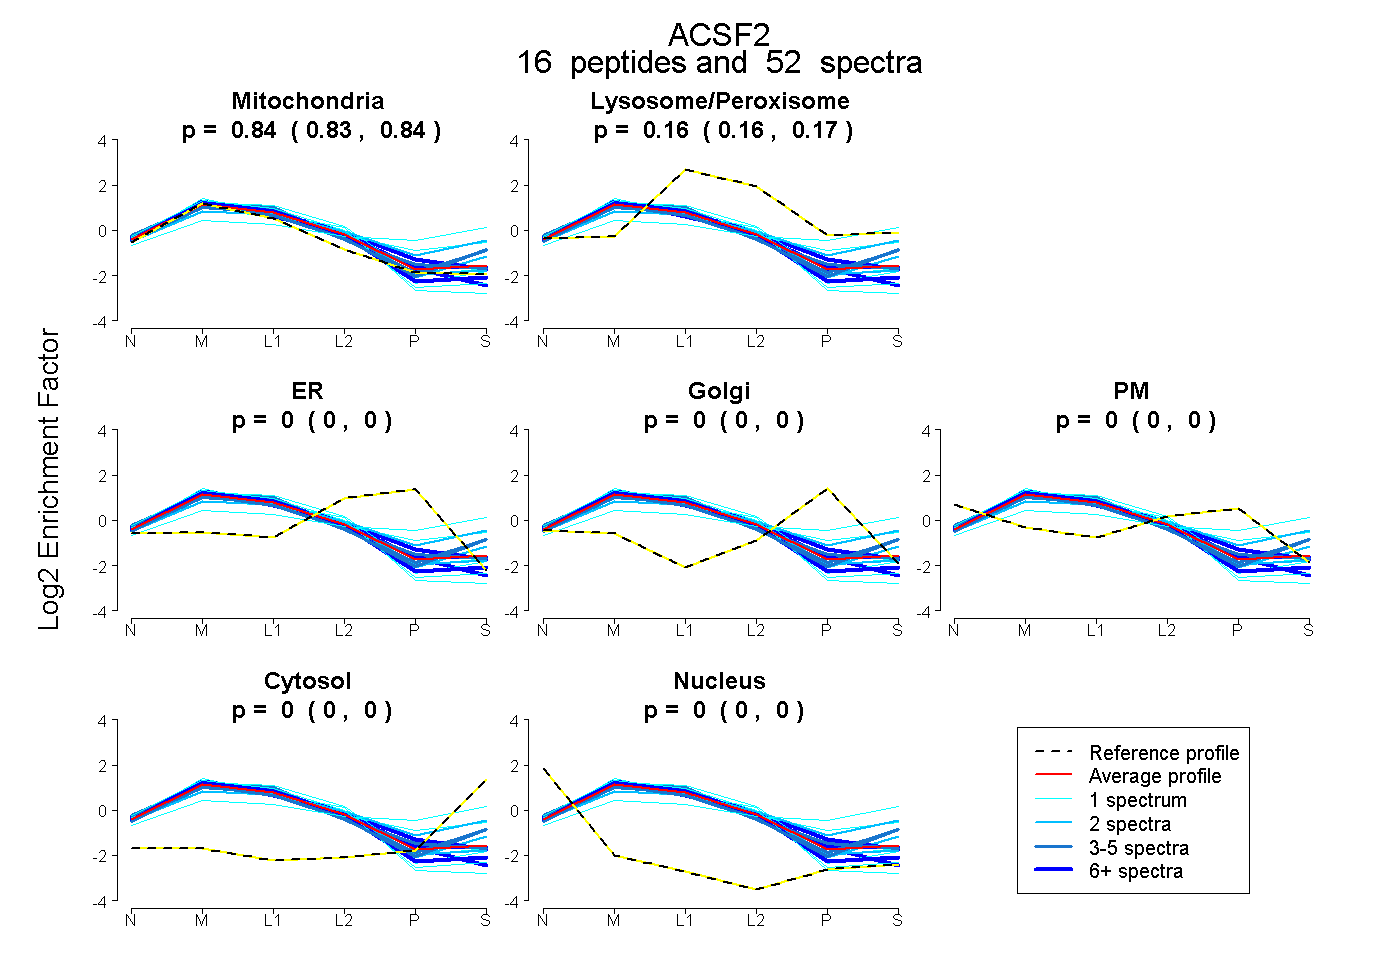
0.833 | 0.843
0.156 | 0.165
0.000 | 0.000
0.000 | 0.000
0.000 | 0.000
0.000 | 0.000
0.000 | 0.000
22peptides
spectra
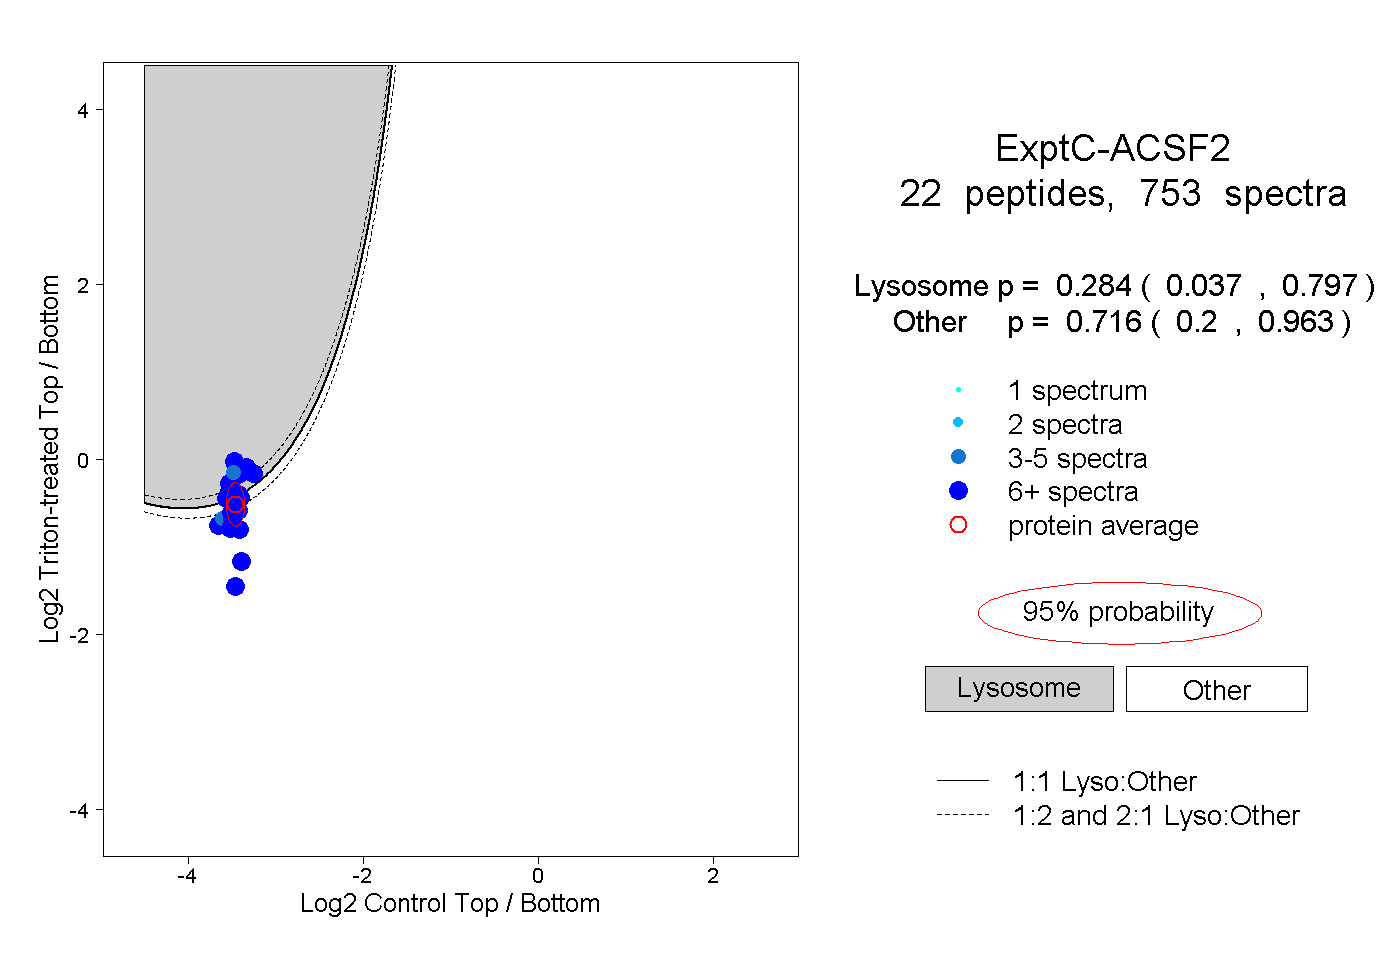
0.037 | 0.797
0.200 | 0.963
14peptides
spectra
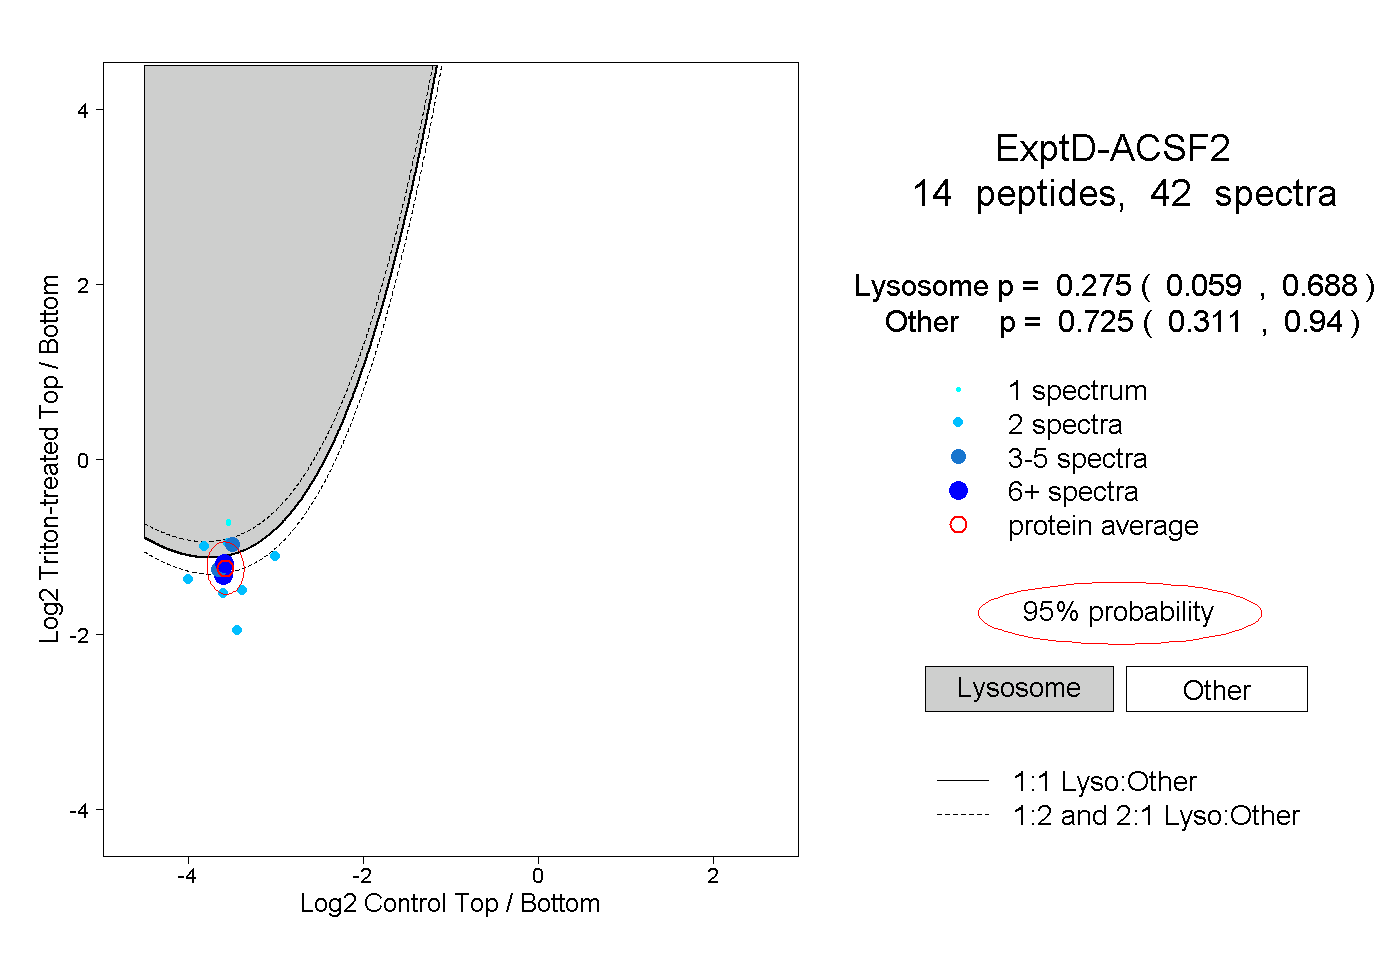
0.059 | 0.688
0.311 | 0.940