 21
21peptides
spectra
0.777 | 0.783
0.059 | 0.069
0.149 | 0.160
0.000 | 0.000
0.000 | 0.000
0.000 | 0.000
0.000 | 0.000
0.000 | 0.000
| Plot | Mito | Lyso | Perox | ER | Golgi | PM | Cytosol | Nucleus | |||||
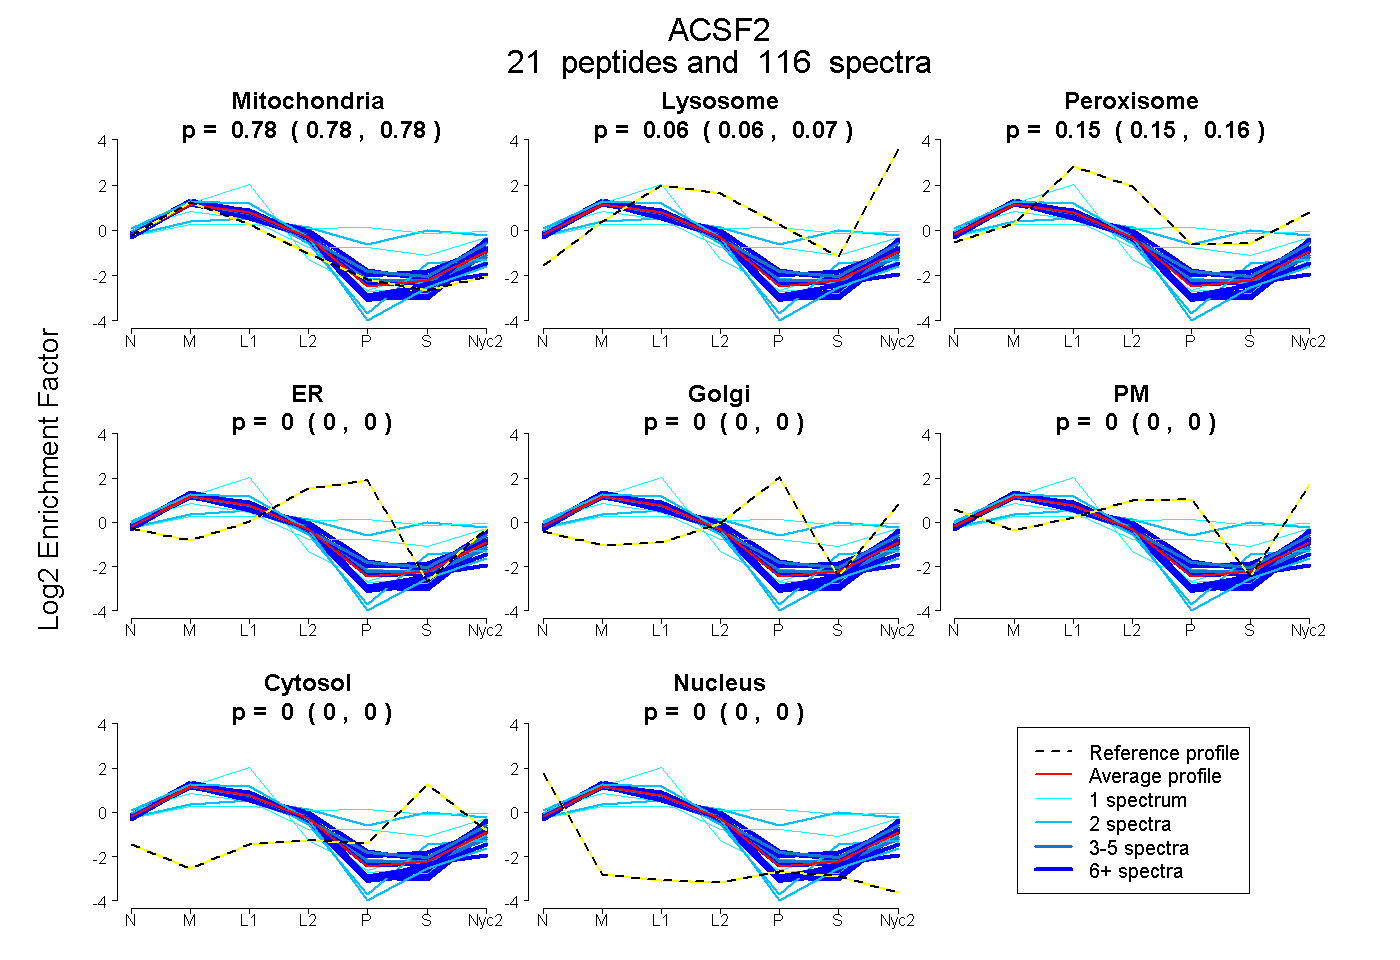
| Expt A |
21 peptides |
116 spectra |
|
0.780 0.777 | 0.783 |
0.065 0.059 | 0.069 |
0.155 0.149 | 0.160 |
0.000 0.000 | 0.000 |
0.000 0.000 | 0.000 |
0.000 0.000 | 0.000 |
0.000 0.000 | 0.000 |
0.000 0.000 | 0.000 |
| 12 spectra, TFETVGQDR | 0.730 | 0.112 | 0.125 | 0.000 | 0.000 | 0.000 | 0.032 | 0.000 | ||
| 2 spectra, GIVFPK | 0.765 | 0.036 | 0.189 | 0.000 | 0.000 | 0.010 | 0.000 | 0.000 | ||
| 3 spectra, LNFAQLK | 0.866 | 0.045 | 0.089 | 0.000 | 0.000 | 0.000 | 0.000 | 0.000 | ||
| 1 spectrum, EQMEQHLK | 0.851 | 0.149 | 0.000 | 0.000 | 0.000 | 0.000 | 0.000 | 0.000 | ||
| 2 spectra, AQPGALK | 0.214 | 0.000 | 0.394 | 0.000 | 0.000 | 0.106 | 0.287 | 0.000 | ||
| 6 spectra, TGDIASMDEQGFCR | 0.792 | 0.204 | 0.004 | 0.000 | 0.000 | 0.000 | 0.000 | 0.000 | ||
| 2 spectra, YIVFVEGYPLTVSGK | 0.907 | 0.000 | 0.093 | 0.000 | 0.000 | 0.000 | 0.000 | 0.000 | ||
| 2 spectra, QVCPELEK | 0.803 | 0.000 | 0.147 | 0.000 | 0.000 | 0.000 | 0.050 | 0.000 | ||
| 1 spectrum, GYCVMQGYWGEPQK | 0.490 | 0.089 | 0.090 | 0.000 | 0.000 | 0.183 | 0.149 | 0.000 | ||
| 12 spectra, LNMPGELCIR | 0.916 | 0.000 | 0.084 | 0.000 | 0.000 | 0.000 | 0.000 | 0.000 | ||
| 6 spectra, GGENIYPAELEDFFHK | 0.767 | 0.073 | 0.160 | 0.000 | 0.000 | 0.000 | 0.000 | 0.000 | ||
| 1 spectrum, IMPHTEAQIVNMETGELTK | 0.133 | 0.000 | 0.372 | 0.000 | 0.255 | 0.000 | 0.239 | 0.000 | ||
| 5 spectra, TQQYYNILK | 0.737 | 0.182 | 0.080 | 0.000 | 0.000 | 0.000 | 0.000 | 0.000 | ||
| 1 spectrum, GATLSHHNIVNNSNLIGQR | 0.749 | 0.000 | 0.251 | 0.000 | 0.000 | 0.000 | 0.000 | 0.000 | ||
| 11 spectra, EQNLAQLR | 0.757 | 0.113 | 0.128 | 0.000 | 0.000 | 0.000 | 0.002 | 0.000 | ||
| 1 spectrum, ALEAISR | 0.844 | 0.000 | 0.156 | 0.000 | 0.000 | 0.000 | 0.000 | 0.000 | ||
| 6 spectra, AGSVGR | 0.849 | 0.121 | 0.030 | 0.000 | 0.000 | 0.000 | 0.000 | 0.000 | ||
| 15 spectra, AASGLLSIGLR | 0.870 | 0.108 | 0.022 | 0.000 | 0.000 | 0.000 | 0.000 | 0.000 | ||
| 3 spectra, HPQVQEAQVVGVK | 0.770 | 0.005 | 0.225 | 0.000 | 0.000 | 0.000 | 0.000 | 0.000 | ||
| 9 spectra, EALVIIHENIR | 0.692 | 0.179 | 0.094 | 0.000 | 0.000 | 0.035 | 0.000 | 0.000 | ||
| 15 spectra, TVGECLDATAQR | 0.858 | 0.000 | 0.142 | 0.000 | 0.000 | 0.000 | 0.000 | 0.000 |
| Plot | Mito | Lyso or Perox | ER | Golgi | PM | Cytosol | Nucleus | ||||||
| Expt B |
16 peptides |
52 spectra |
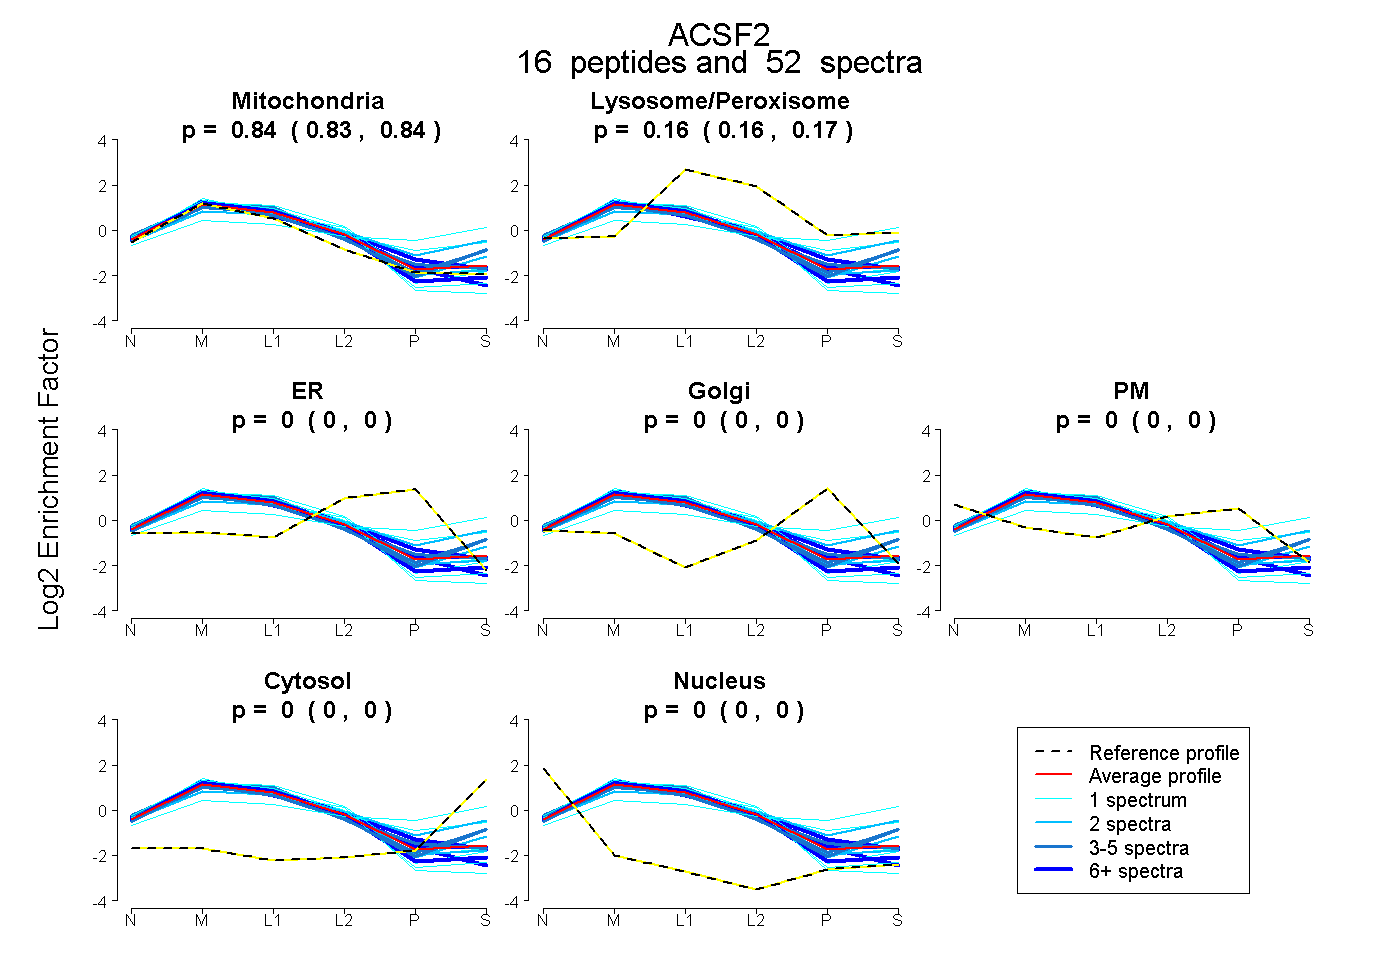 |
0.839 0.833 | 0.843 |
0.161 0.156 | 0.165 |
0.000 0.000 | 0.000 |
0.000 0.000 | 0.000 |
0.000 0.000 | 0.000 |
0.000 0.000 | 0.000 |
0.000 0.000 | 0.000 |
|||
| Plot | Lyso | Other | |||||||||||
| Expt C |
22 peptides |
753 spectra |
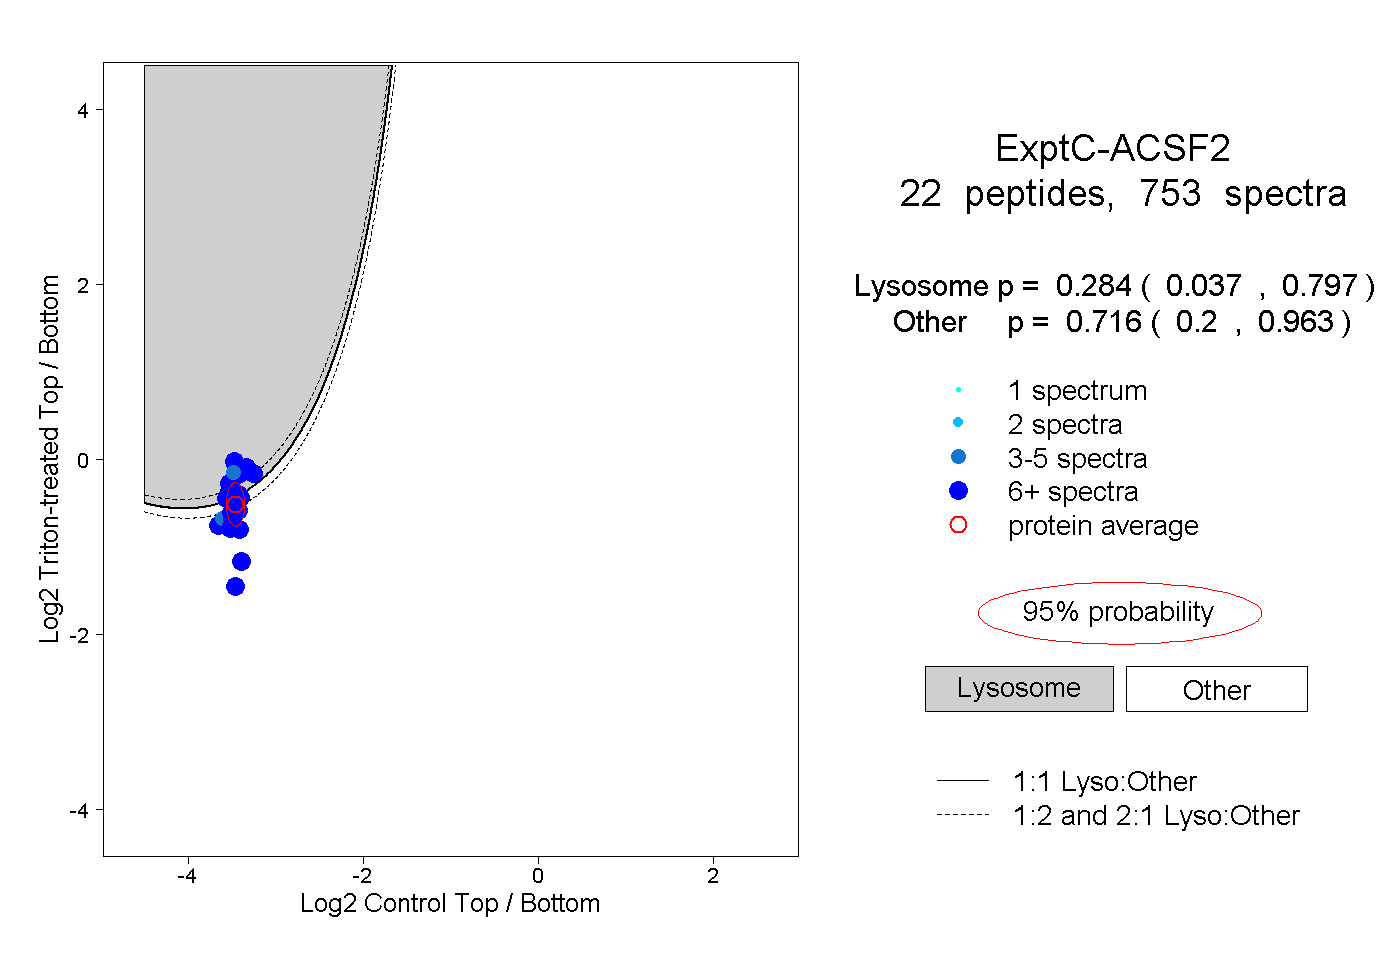 |
0.284 0.037 | 0.797 |
0.716 0.200 | 0.963 |
||||||||
| Plot | Lyso | Other | |||||||||||
| Expt D |
14 peptides |
42 spectra |
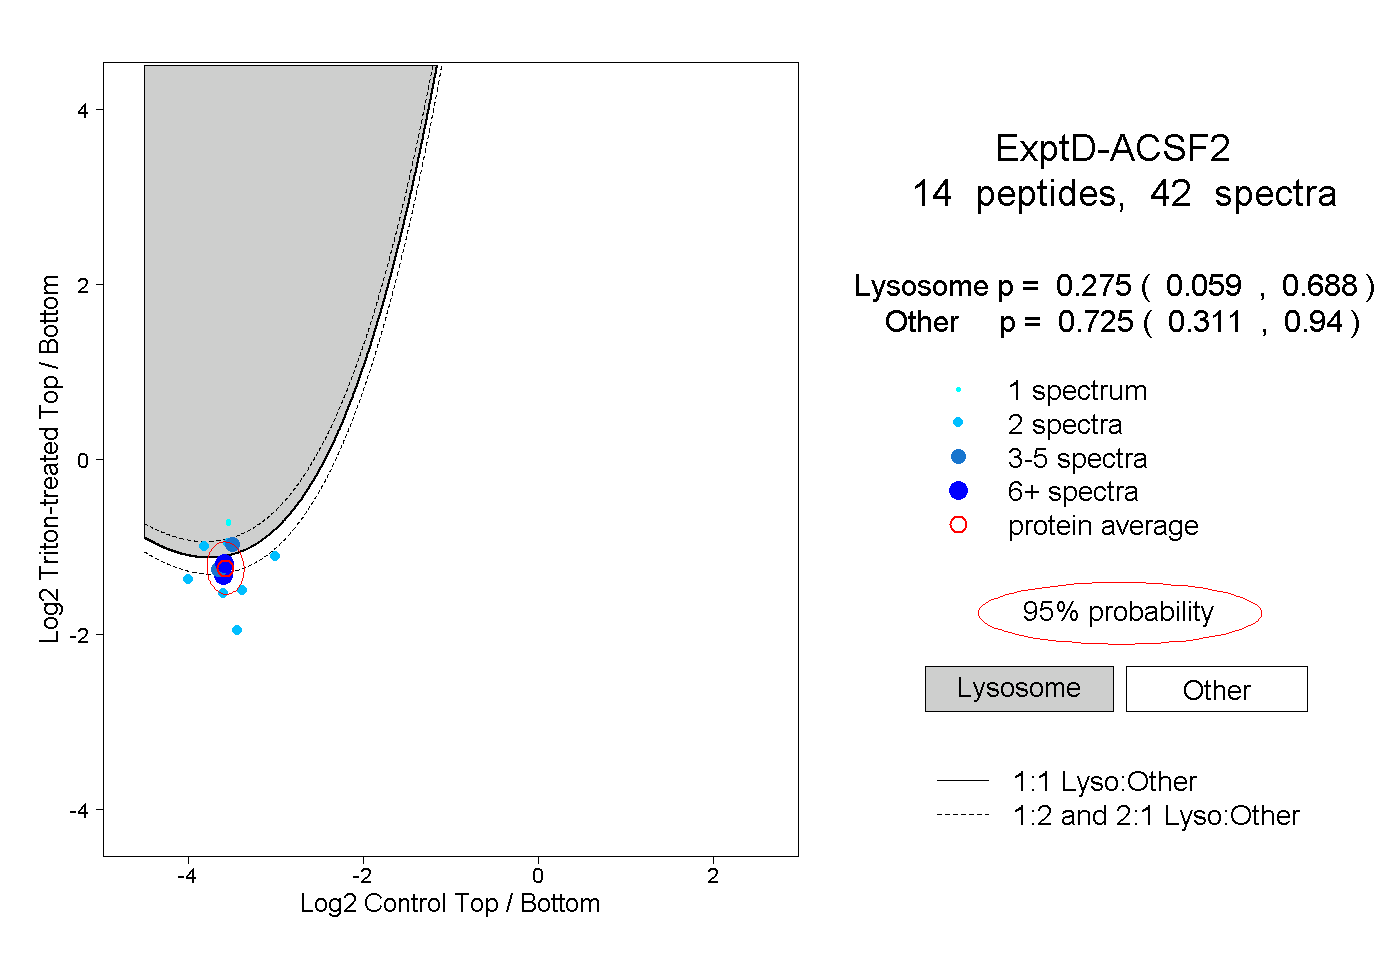 |
0.275 0.059 | 0.688 |
0.725 0.311 | 0.940 |