 3
3peptides
spectra
0.028 | 0.139
0.163 | 0.289
0.169 | 0.307
0.000 | 0.000
0.000 | 0.123
0.190 | 0.370
0.073 | 0.152
0.000 | 0.000
4peptides
spectra

0.000 | 0.175
0.820 | 1.000
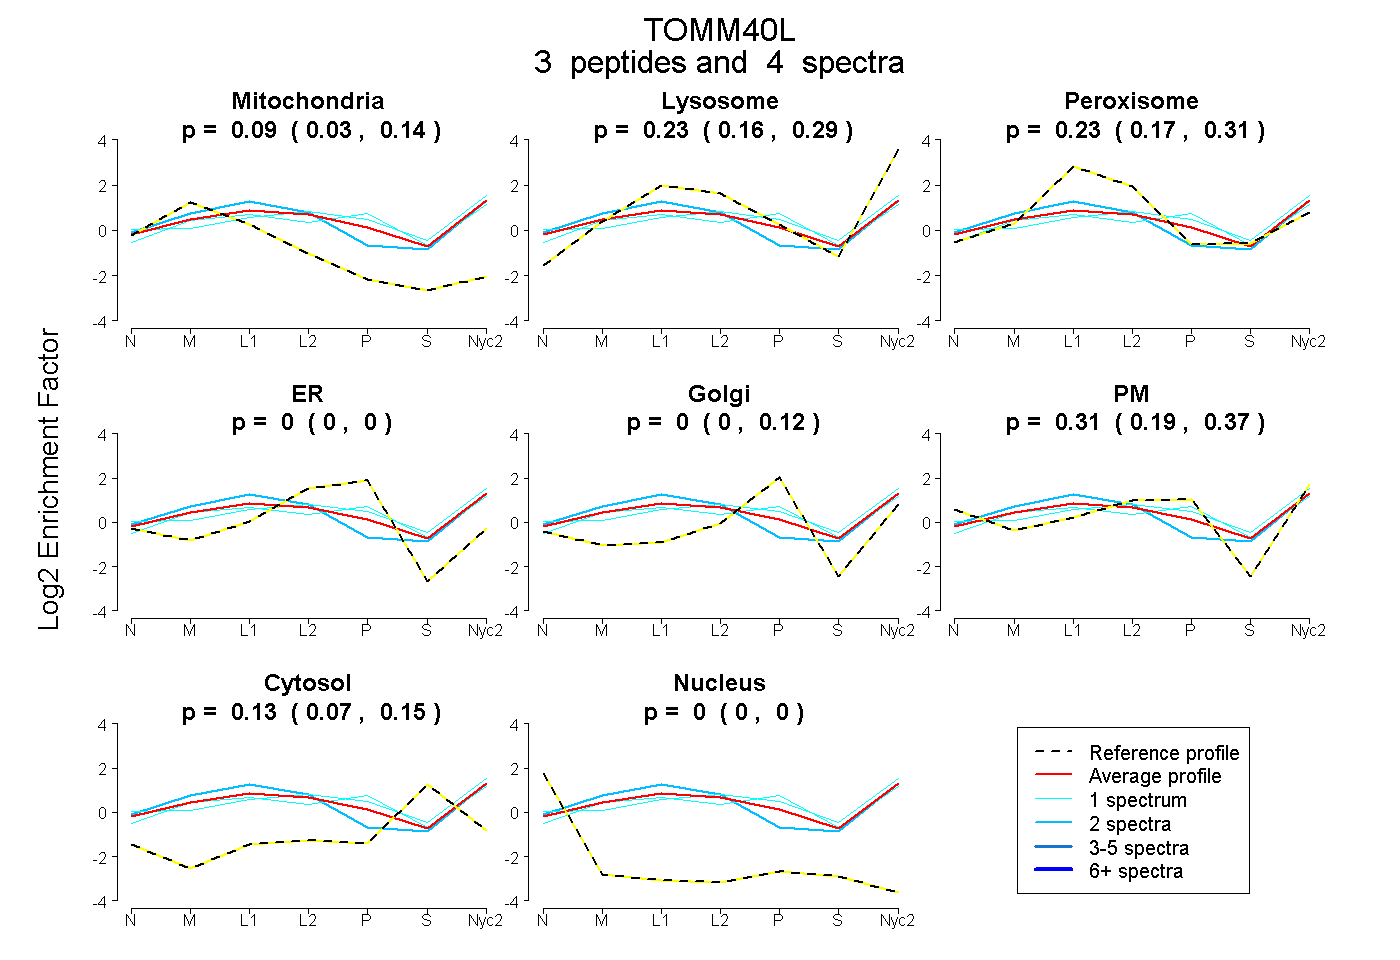
| Plot | Mito | Lyso | Perox | ER | Golgi | PM | Cytosol | Nucleus | |||||
| Expt A |
3 peptides |
4 spectra |
|
0.091 0.028 | 0.139 |
0.235 0.163 | 0.289 |
0.233 0.169 | 0.307 |
0.000 0.000 | 0.000 |
0.000 0.000 | 0.123 |
0.315 0.190 | 0.370 |
0.126 0.073 | 0.152 |
0.000 0.000 | 0.000 |
||
| Plot | Lyso | Other | |||||||||||
| Expt C |
4 peptides |
13 spectra |
|
0.003 0.000 | 0.175 |
0.997 0.820 | 1.000 |