 17
17peptides
spectra
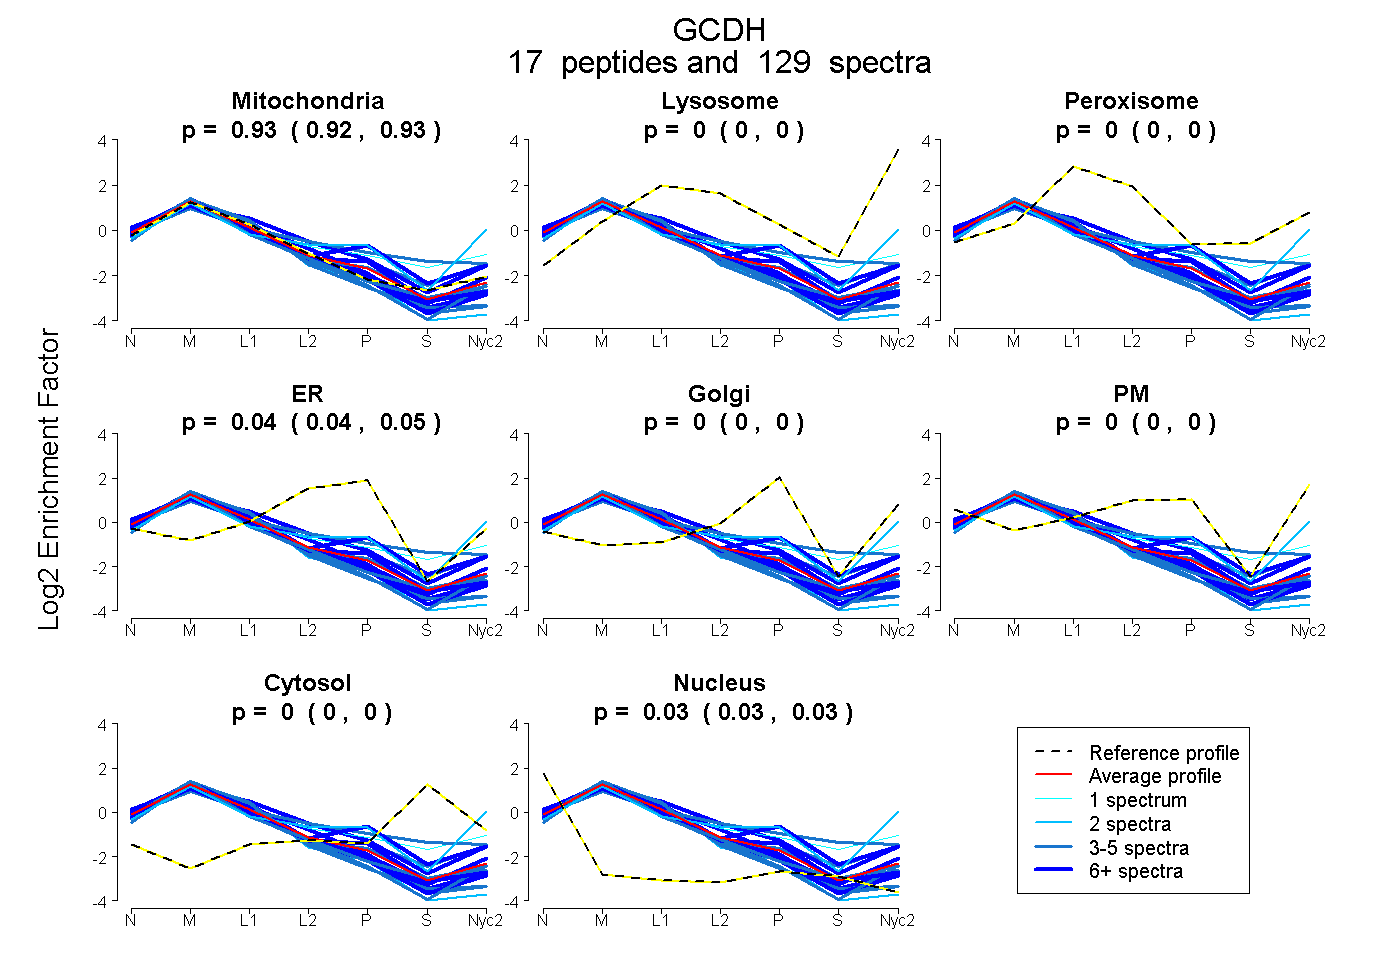
0.922 | 0.929
0.000 | 0.000
0.000 | 0.000
0.038 | 0.046
0.000 | 0.000
0.000 | 0.000
0.000 | 0.000
0.030 | 0.033
16peptides
spectra
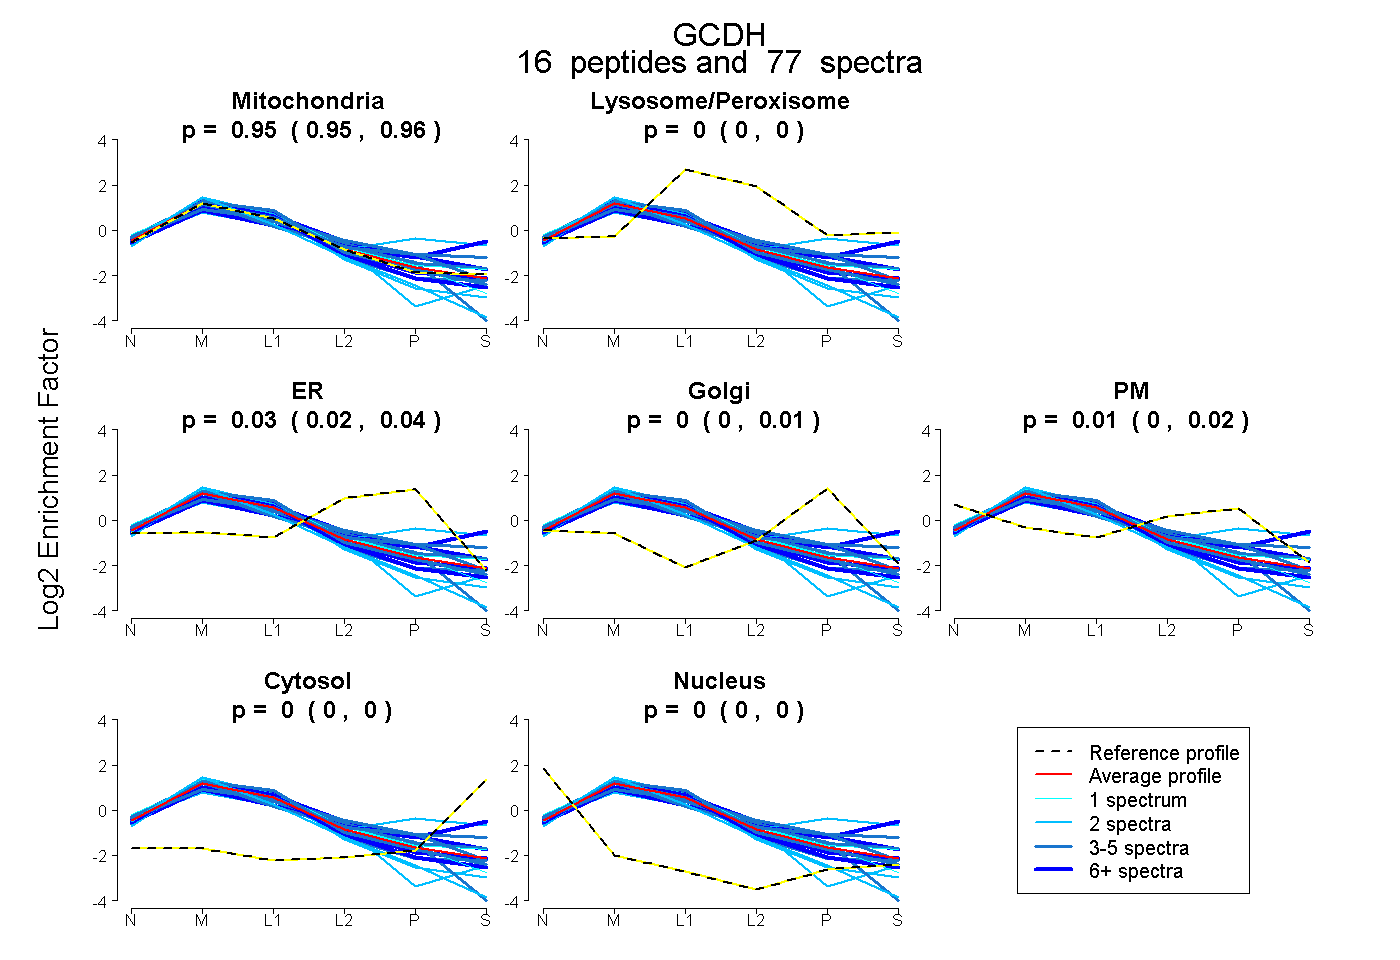
0.949 | 0.961
0.000 | 0.000
0.021 | 0.040
0.000 | 0.006
0.003 | 0.019
0.000 | 0.000
0.000 | 0.000
22peptides
spectra
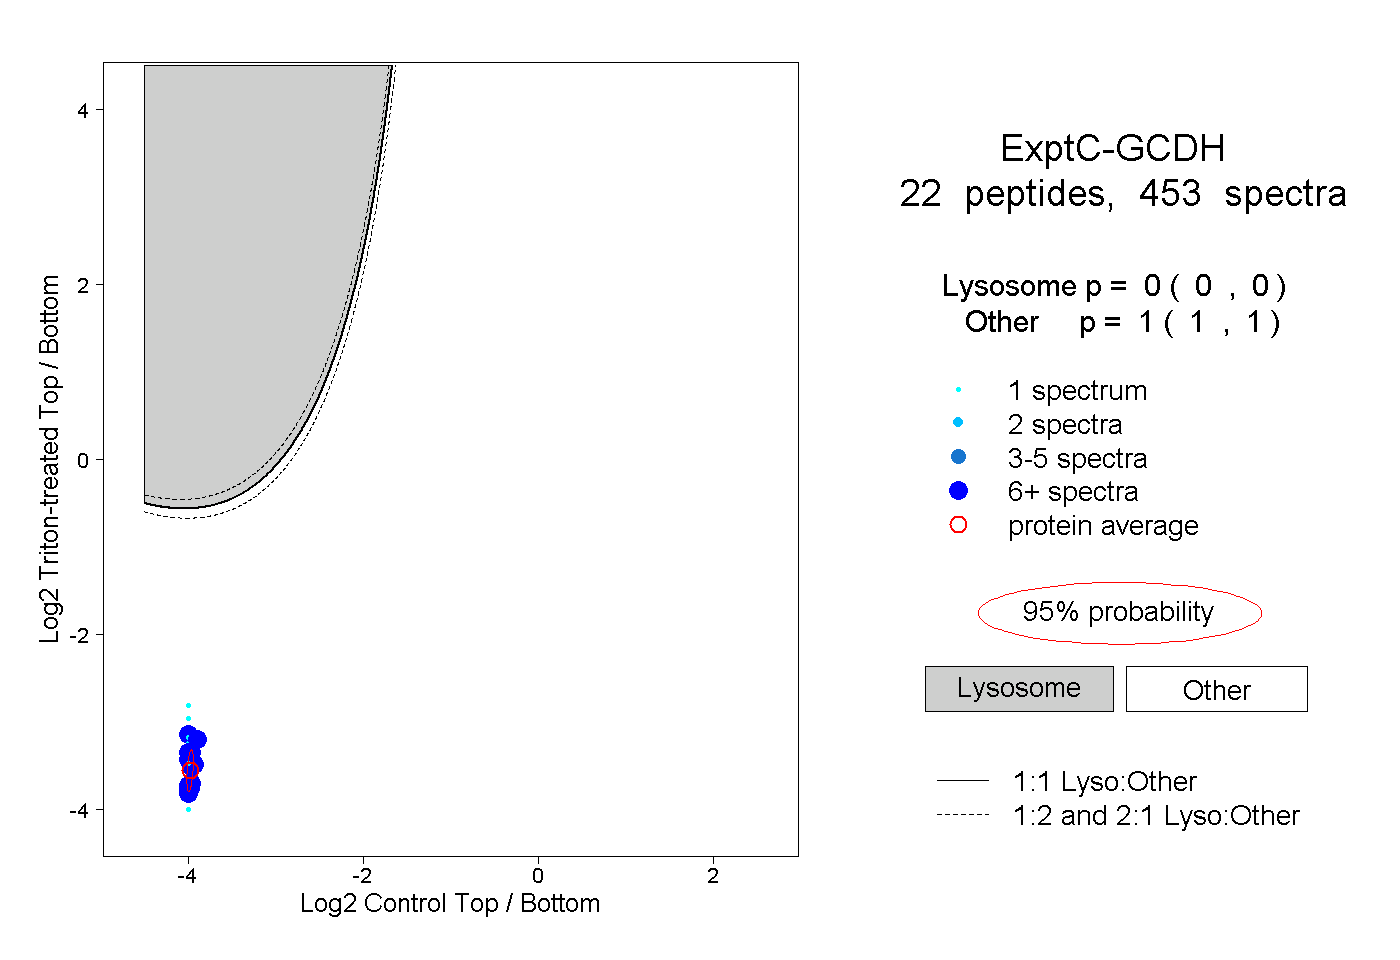
0.000 | 0.000
1.000 | 1.000
12peptides
spectra
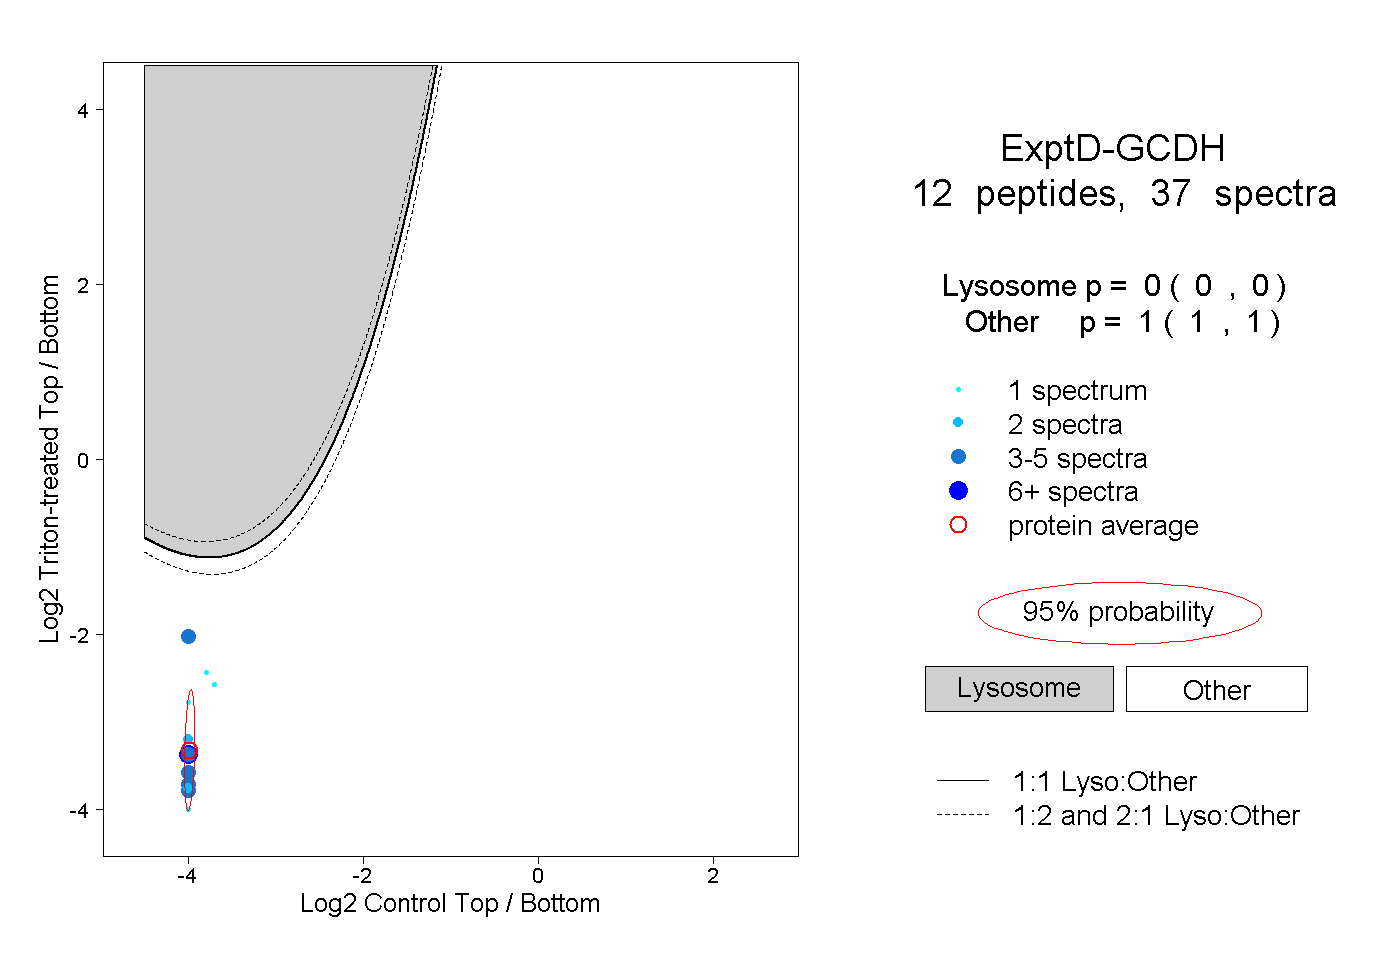
0.000 | 0.000
1.000 | 1.000