 12
12peptides
spectra
0.000 | 0.000
0.000 | 0.000
0.044 | 0.052
0.000 | 0.000
0.000 | 0.000
0.481 | 0.487
0.465 | 0.470
0.000 | 0.000
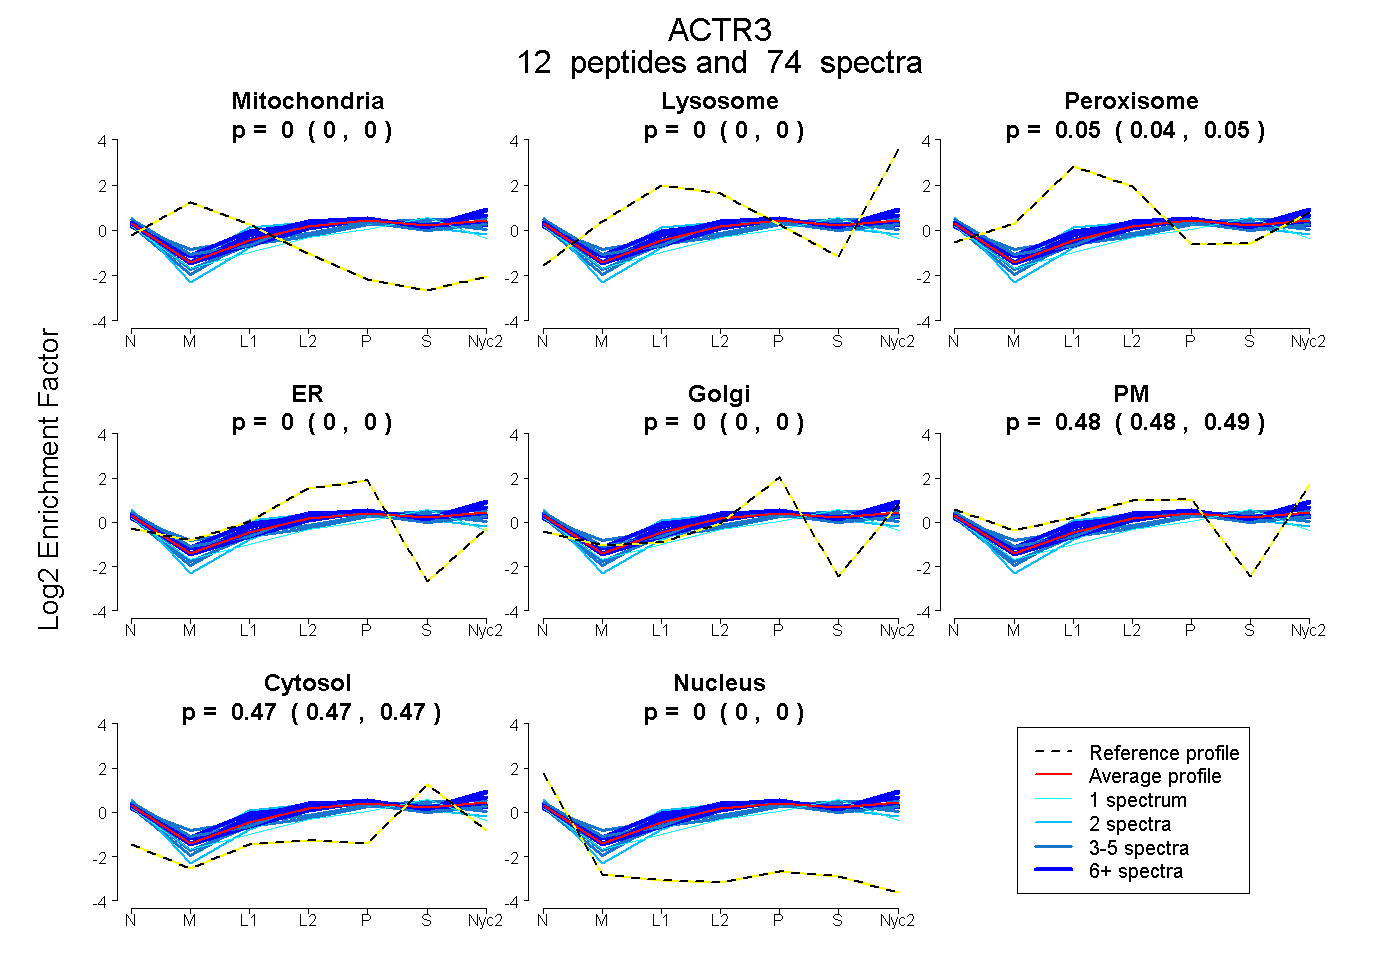
| Plot | Mito | Lyso | Perox | ER | Golgi | PM | Cytosol | Nucleus | |||||
| Expt A |
12 peptides |
74 spectra |
|
0.000 0.000 | 0.000 |
0.000 0.000 | 0.000 |
0.048 0.044 | 0.052 |
0.000 0.000 | 0.000 |
0.000 0.000 | 0.000 |
0.484 0.481 | 0.487 |
0.468 0.465 | 0.470 |
0.000 0.000 | 0.000 |
| 4 spectra, AEPEDHYFLLTEPPLNTPENR | 0.000 | 0.000 | 0.115 | 0.000 | 0.000 | 0.455 | 0.429 | 0.000 | ||
| 9 spectra, HGIVEDWDLMER | 0.000 | 0.000 | 0.019 | 0.058 | 0.000 | 0.440 | 0.483 | 0.000 | ||
| 9 spectra, HNPVFGVMS | 0.000 | 0.054 | 0.095 | 0.000 | 0.000 | 0.452 | 0.399 | 0.000 | ||
| 3 spectra, QYTGVNAISK | 0.000 | 0.000 | 0.034 | 0.041 | 0.000 | 0.492 | 0.433 | 0.000 | ||
| 12 spectra, VGDQAQR | 0.000 | 0.002 | 0.033 | 0.000 | 0.000 | 0.547 | 0.418 | 0.000 | ||
| 9 spectra, NIVLSGGSTMFR | 0.000 | 0.000 | 0.016 | 0.000 | 0.000 | 0.522 | 0.462 | 0.000 | ||
| 2 spectra, FMEQVIFK | 0.000 | 0.000 | 0.000 | 0.000 | 0.000 | 0.501 | 0.499 | 0.000 | ||
| 5 spectra, DYEEIGPSICR | 0.000 | 0.000 | 0.009 | 0.000 | 0.000 | 0.443 | 0.547 | 0.000 | ||
| 4 spectra, EFSIDVGYER | 0.000 | 0.000 | 0.000 | 0.020 | 0.000 | 0.415 | 0.565 | 0.000 | ||
| 2 spectra, EVGIPPEQSLETAK | 0.000 | 0.000 | 0.191 | 0.162 | 0.000 | 0.222 | 0.411 | 0.014 | ||
| 1 spectrum, YSYVCPDLVK | 0.000 | 0.000 | 0.000 | 0.081 | 0.000 | 0.283 | 0.627 | 0.009 | ||
| 14 spectra, HIPIAGR | 0.000 | 0.000 | 0.105 | 0.070 | 0.000 | 0.387 | 0.437 | 0.000 |
| Plot | Mito | Lyso or Perox | ER | Golgi | PM | Cytosol | Nucleus | ||||||
| Expt B |
13 peptides |
30 spectra |
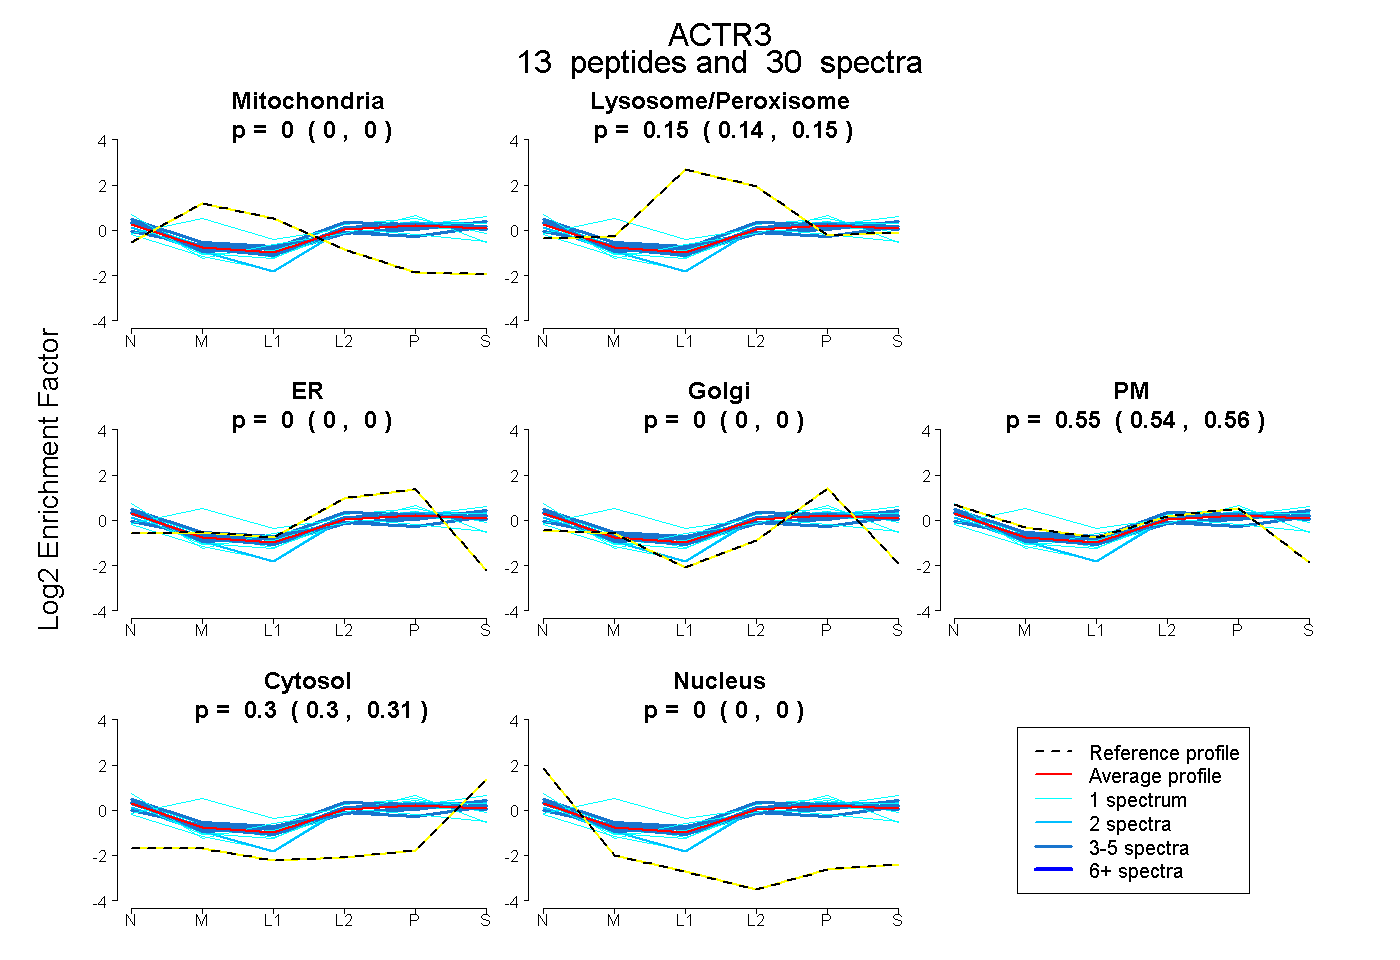 |
0.000 0.000 | 0.000 |
0.146 0.138 | 0.151 |
0.000 0.000 | 0.000 |
0.000 0.000 | 0.000 |
0.553 0.544 | 0.560 |
0.302 0.297 | 0.306 |
0.000 0.000 | 0.000 |
|||
| Plot | Lyso | Other | |||||||||||
| Expt C |
13 peptides |
87 spectra |
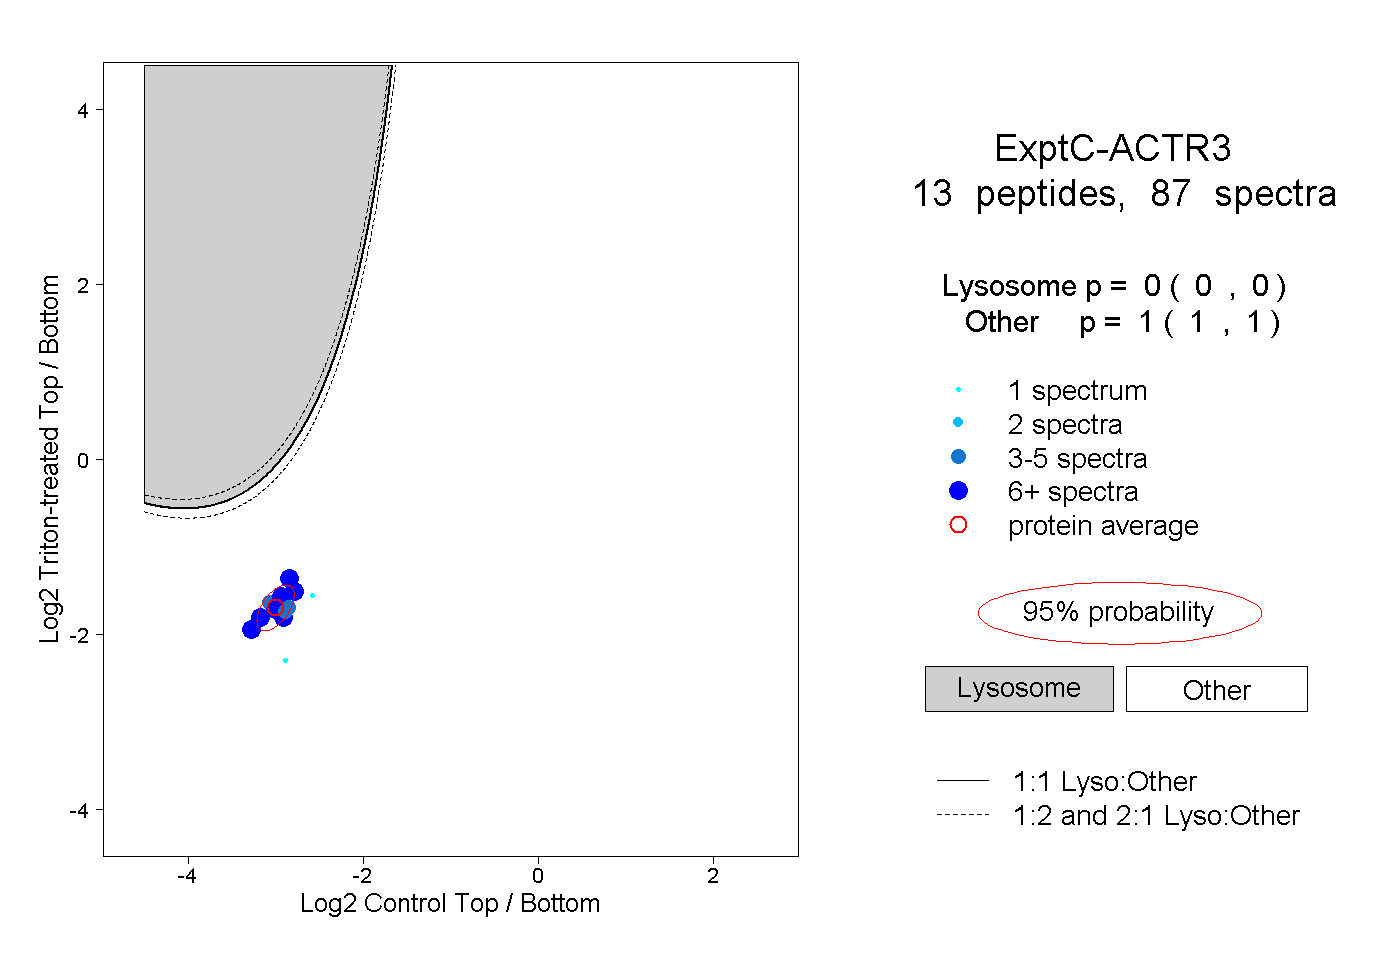 |
0.000 0.000 | 0.000 |
1.000 1.000 | 1.000 |
||||||||
| Plot | Lyso | Other | |||||||||||
| Expt D |
4 peptides |
13 spectra |
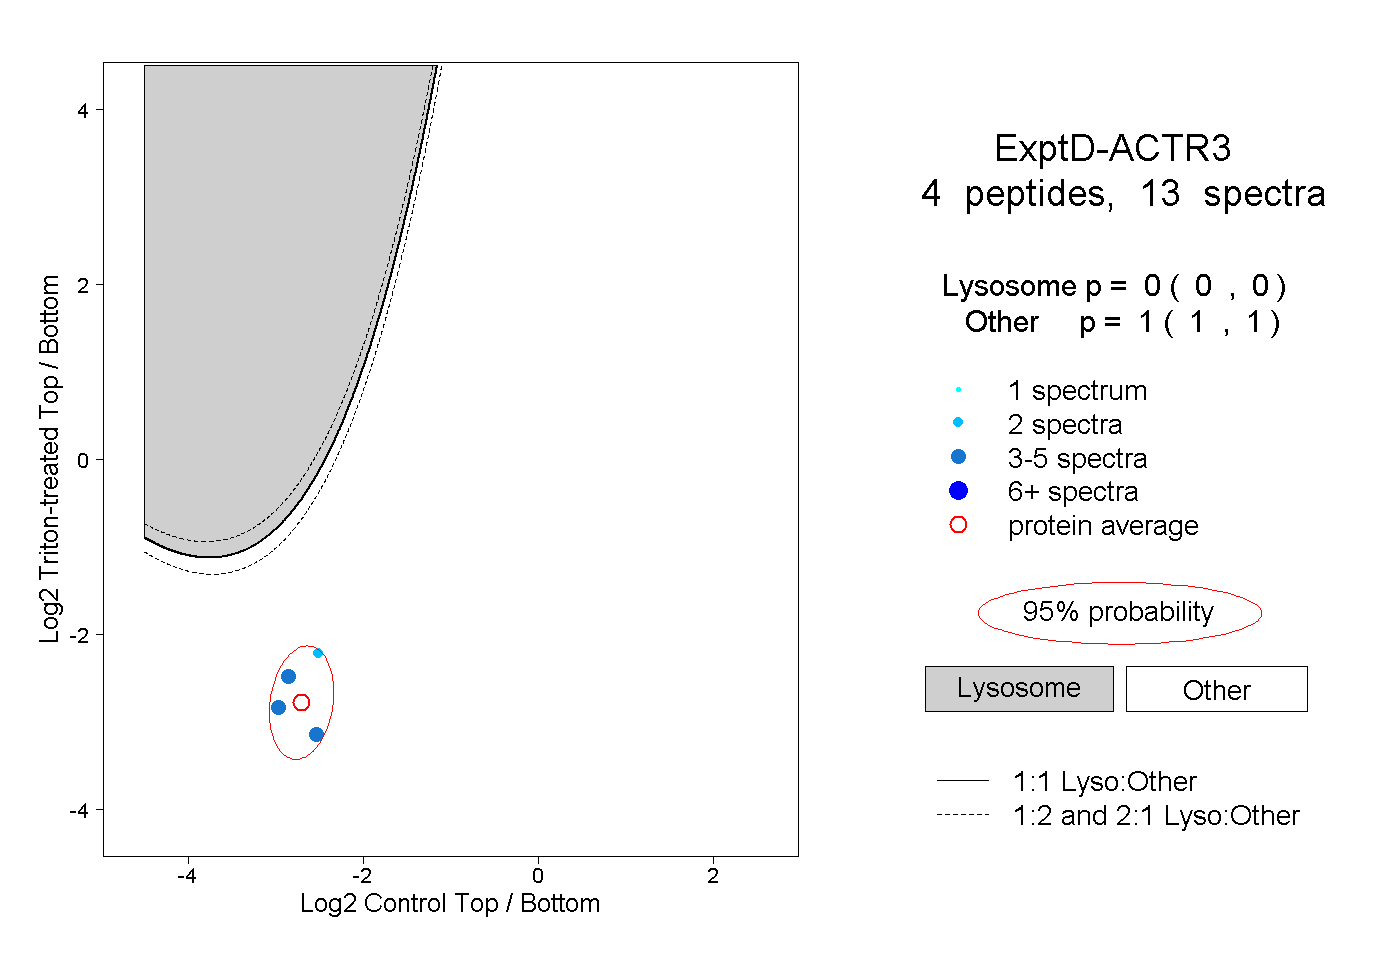 |
0.000 0.000 | 0.000 |
1.000 1.000 | 1.000 |