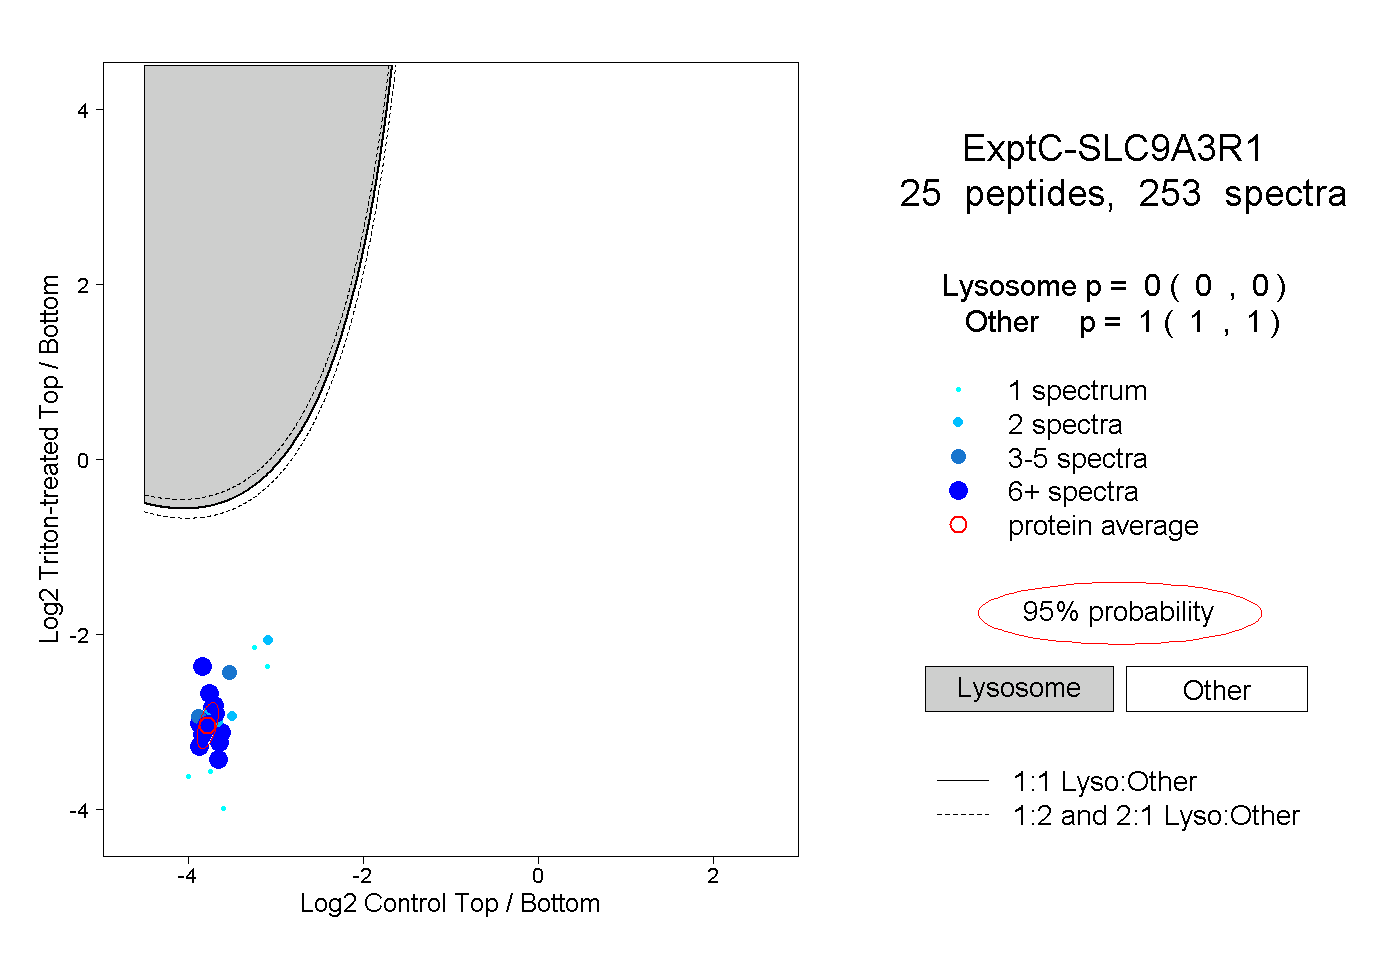
25
25peptides
spectra
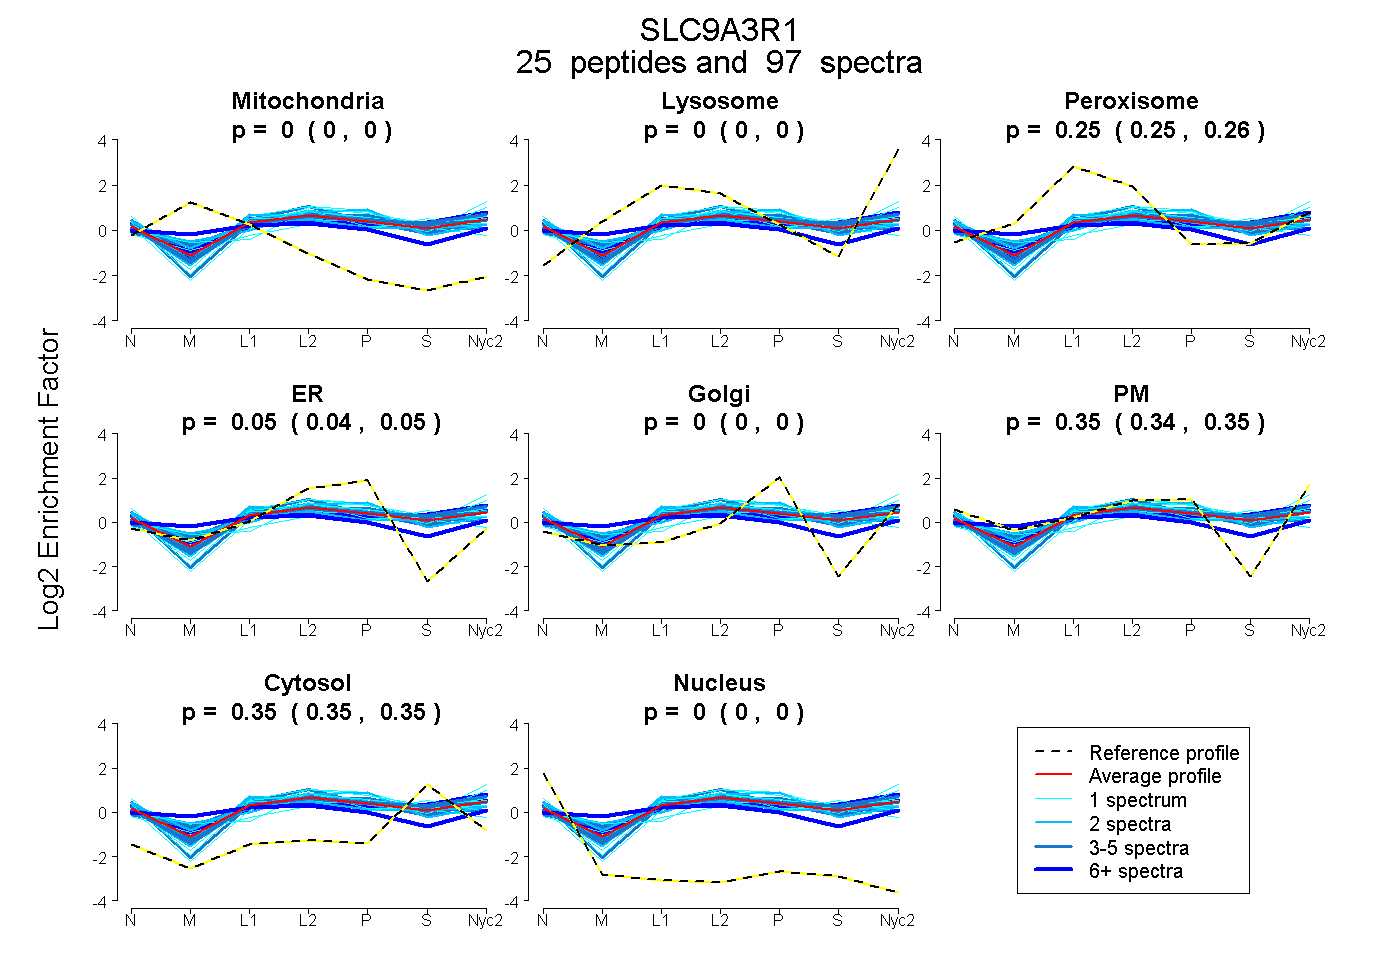
0.000 | 0.000
0.000 | 0.000
0.252 | 0.257
0.041 | 0.051
0.000 | 0.000
0.344 | 0.354
0.347 | 0.351
0.000 | 0.000
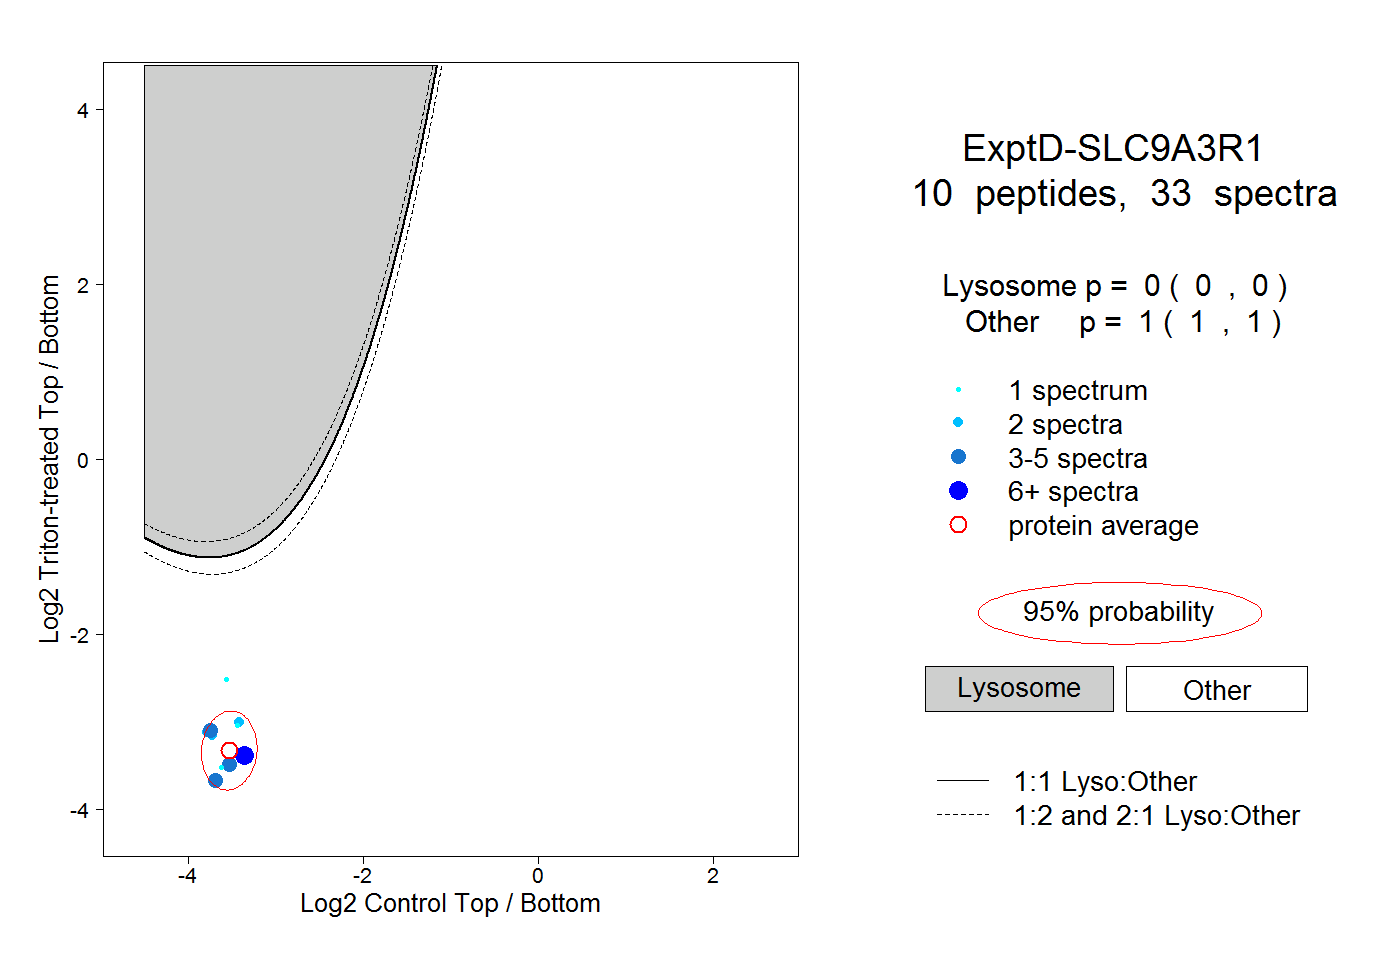
10peptides
spectra
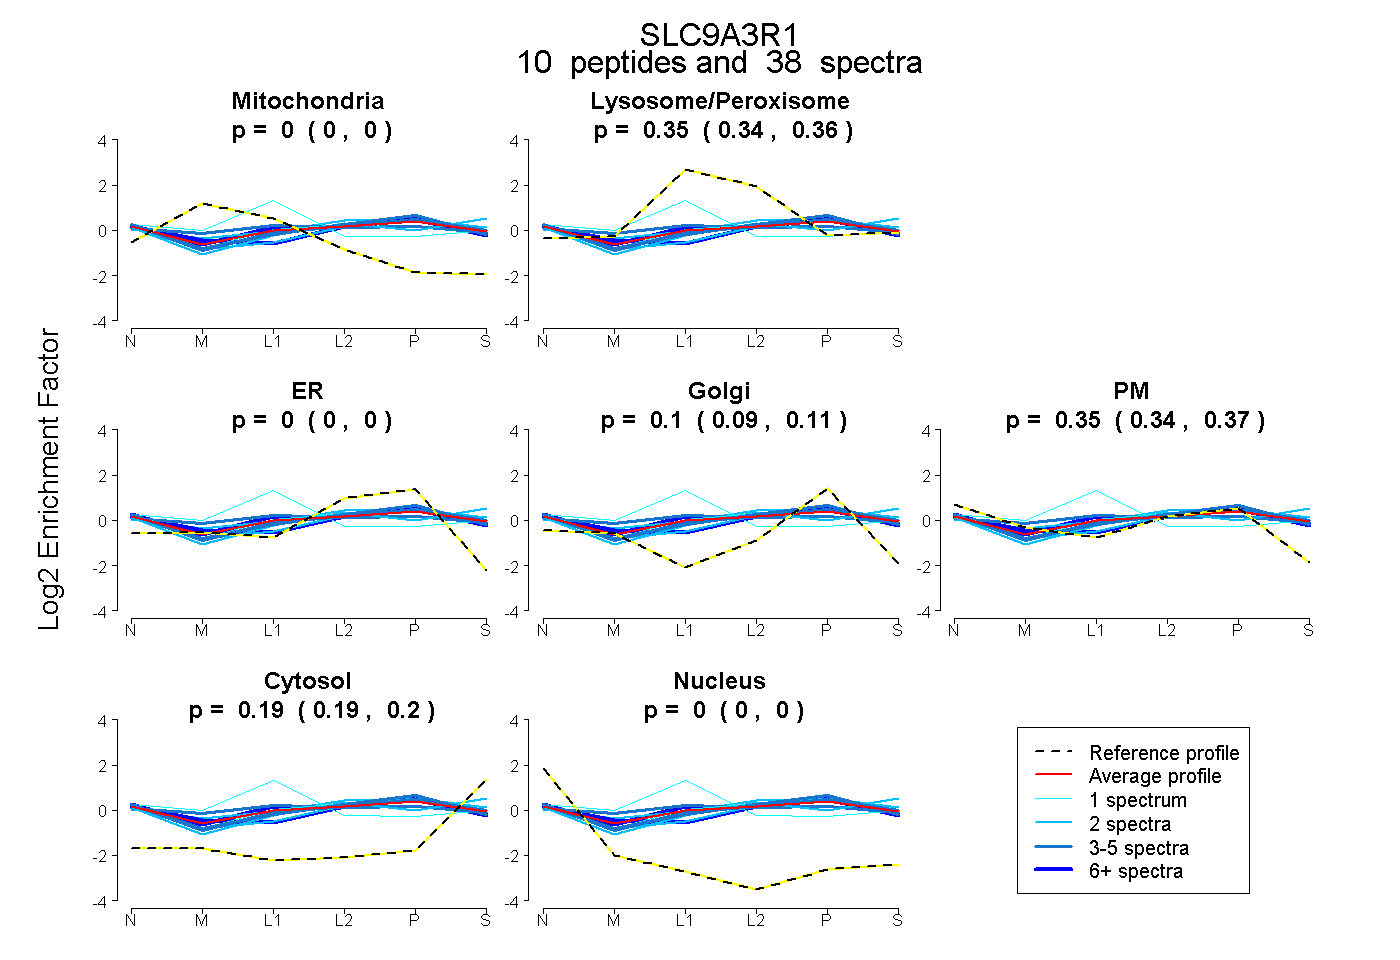
0.000 | 0.000
0.339 | 0.358
0.000 | 0.000
0.088 | 0.114
0.339 | 0.367
0.188 | 0.199
0.000 | 0.000