SERPINF2
[ENSRNOP00000004322]
Main page
| | | Plot |
Mito |
Lyso |
|
Perox |
ER |
Golgi |
PM |
Cytosol |
Nucleus |
|
| Expt A |
 10
10
peptides |
24
spectra |
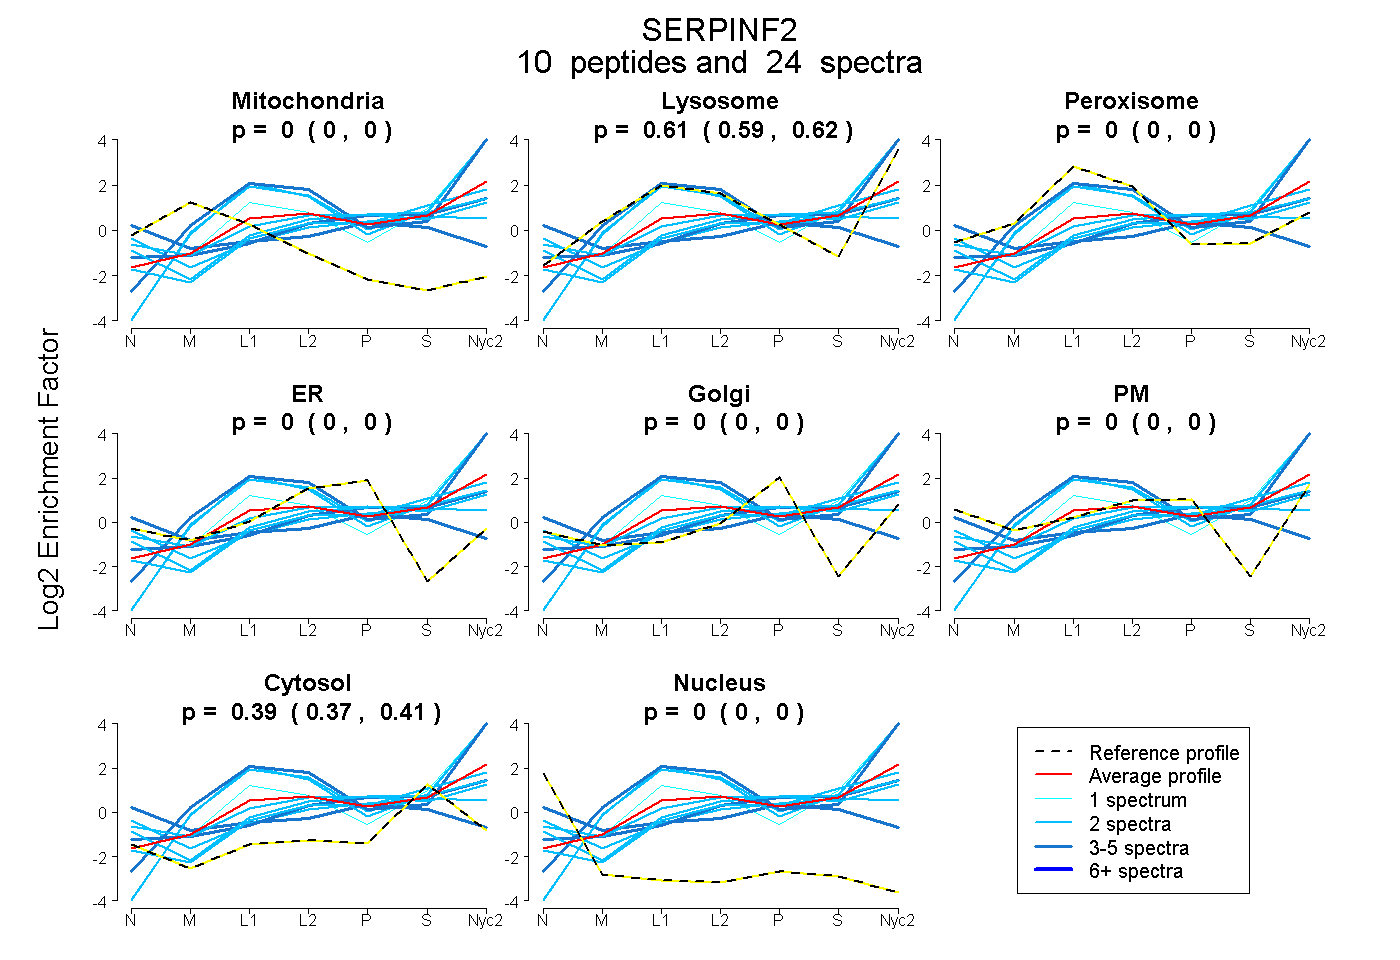 |
0.000
0.000 | 0.000 |
0.608
0.589 | 0.623 |
|
0.000
0.000 | 0.000 |
0.000
0.000 | 0.000 |
0.000
0.000 | 0.000 |
0.000
0.000 | 0.000 |
0.392
0.373 | 0.407 |
0.000
0.000 | 0.000 |
|
| | | Plot |
Mito |
|
Lyso or Perox |
|
ER |
Golgi |
PM |
Cytosol |
Nucleus |
|
| Expt B |
4
peptides |
13
spectra |
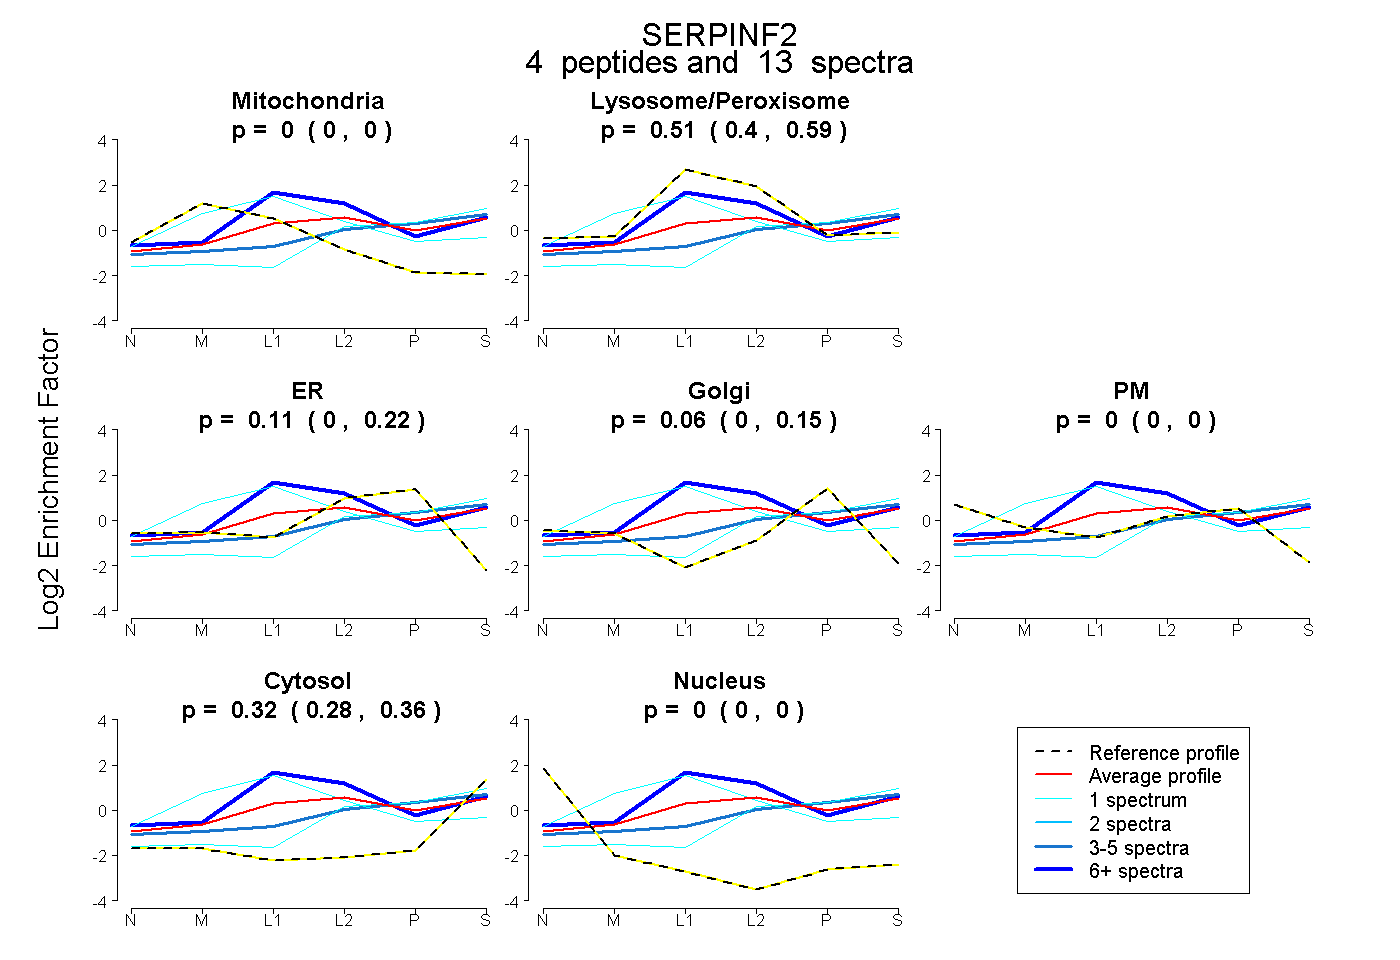 |
0.000
0.000 | 0.000 |
|
0.505
0.399 | 0.590 |
|
0.111
0.000 | 0.224 |
0.060
0.000 | 0.153 |
0.000
0.000 | 0.000 |
0.324
0.275 | 0.364 |
0.000
0.000 | 0.000 |
|
| 1 spectrum, QEEDLMNINK |
0.353 |
|
0.549 |
|
0.000 |
0.028 |
0.000 |
0.071 |
0.000 |
|
| 1 spectrum, SAPTTEETR |
0.000 |
|
0.094 |
|
0.355 |
0.000 |
0.000 |
0.552 |
0.000 |
|
| 4 spectra, LPPLALLK |
0.000 |
|
0.288 |
|
0.176 |
0.115 |
0.000 |
0.421 |
0.000 |
|
| 7 spectra, LGLQDLFQSPDLR |
0.000 |
|
0.794 |
|
0.000 |
0.000 |
0.000 |
0.206 |
0.000 |
|
| | | Plot |
|
Lyso |
|
|
|
|
|
|
|
Other |
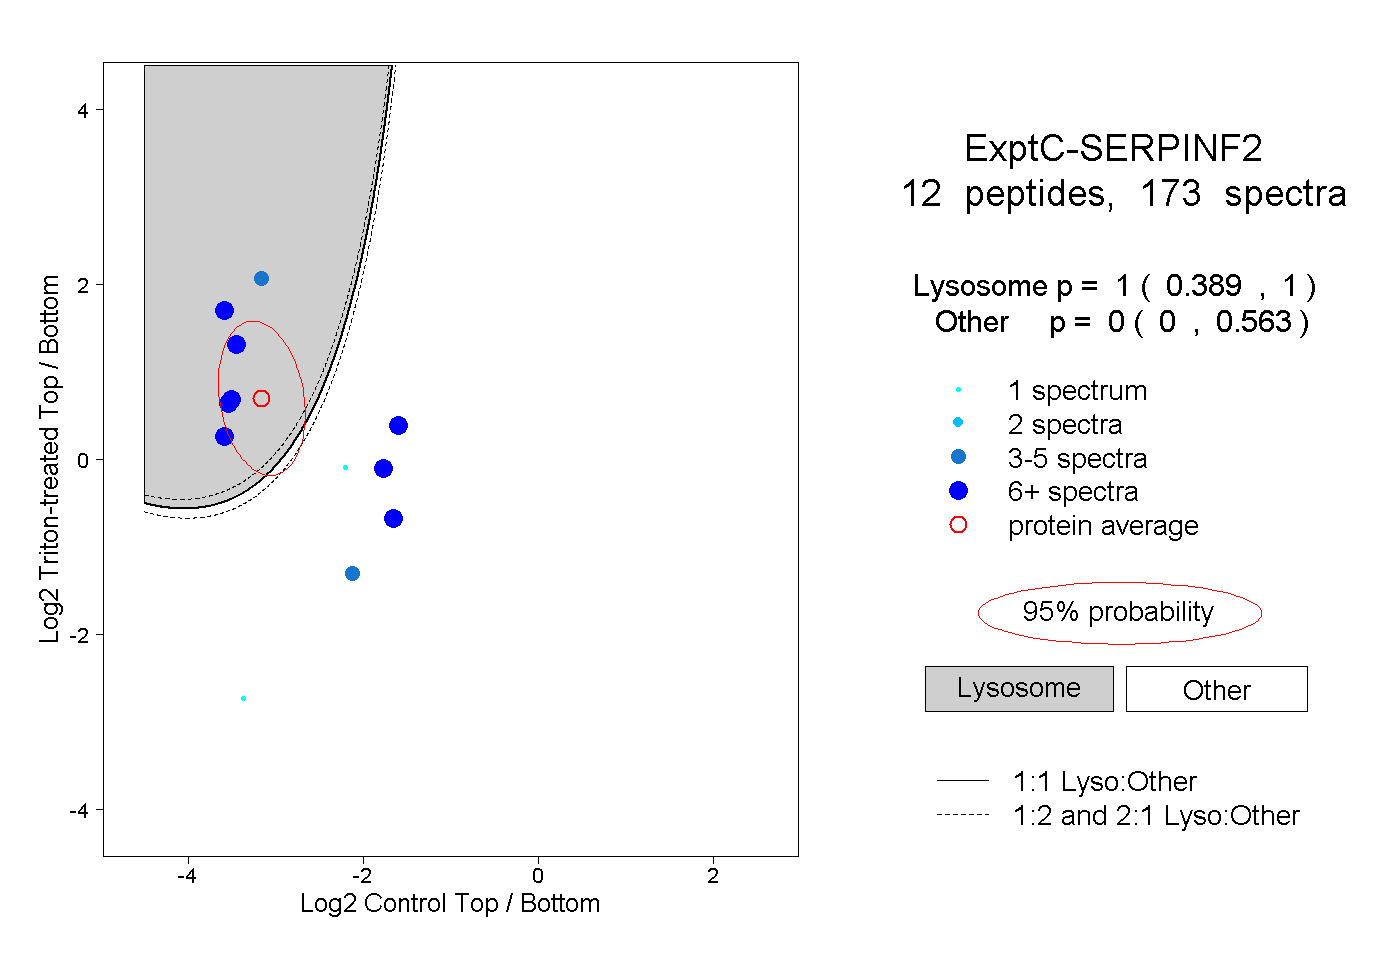
| Expt C |
12
peptides |
173
spectra |
 |
|
1.000
0.389 | 1.000 |
|
|
|
|
|
|
|
0.000
0.000 | 0.563 |
| | | Plot |
|
Lyso |
|
|
|
|
|
|
|
Other |
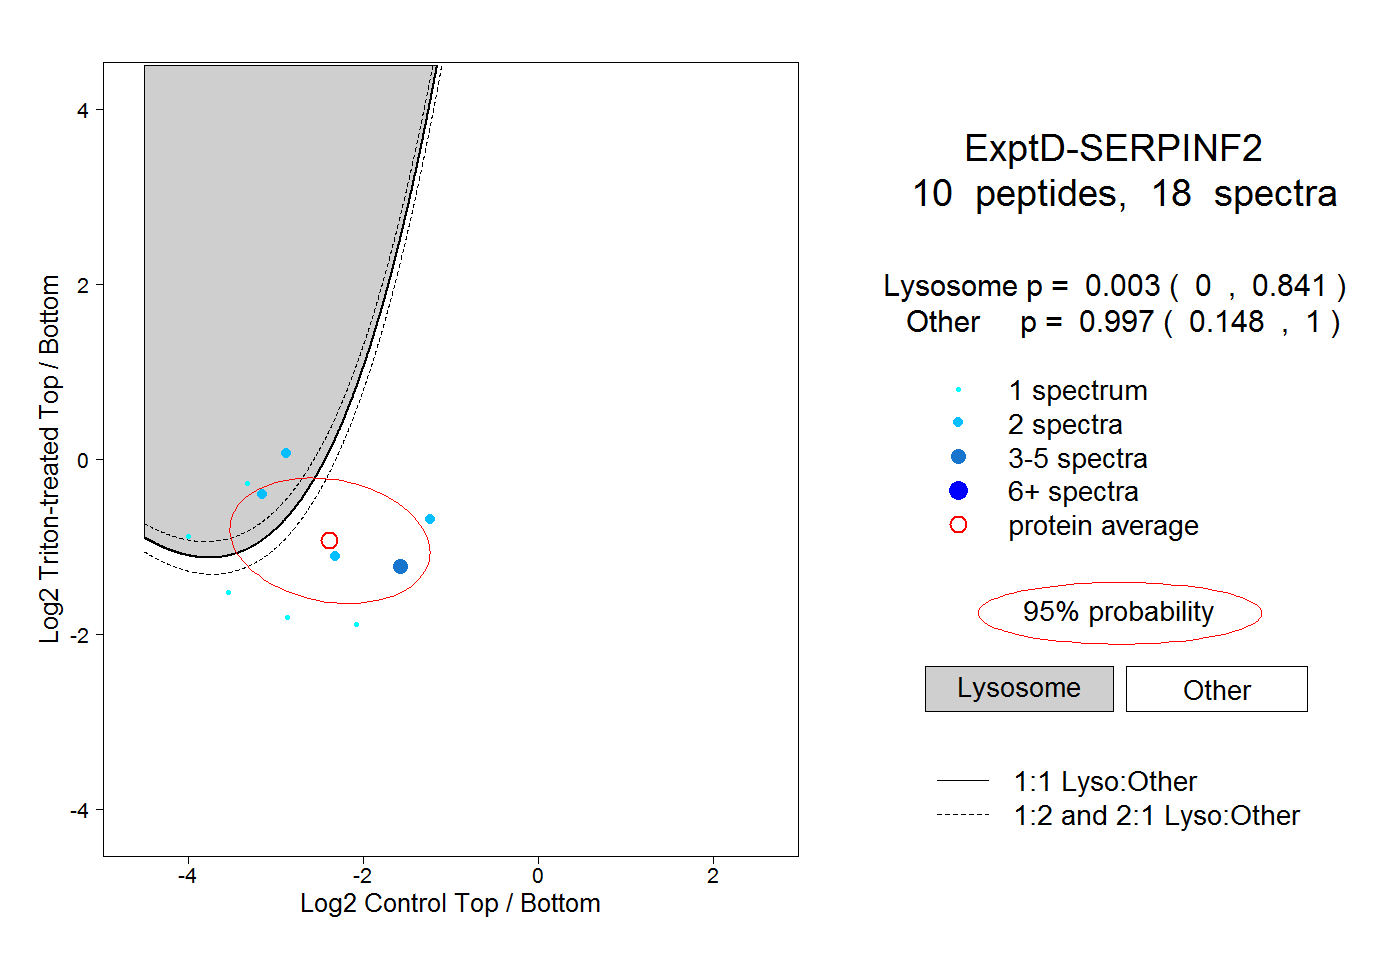
| Expt D |
10
peptides |
18
spectra |
 |
|
0.003
0.000 | 0.841 |
|
|
|
|
|
|
|
0.997
0.148 | 1.000 |