 22
22peptides
spectra
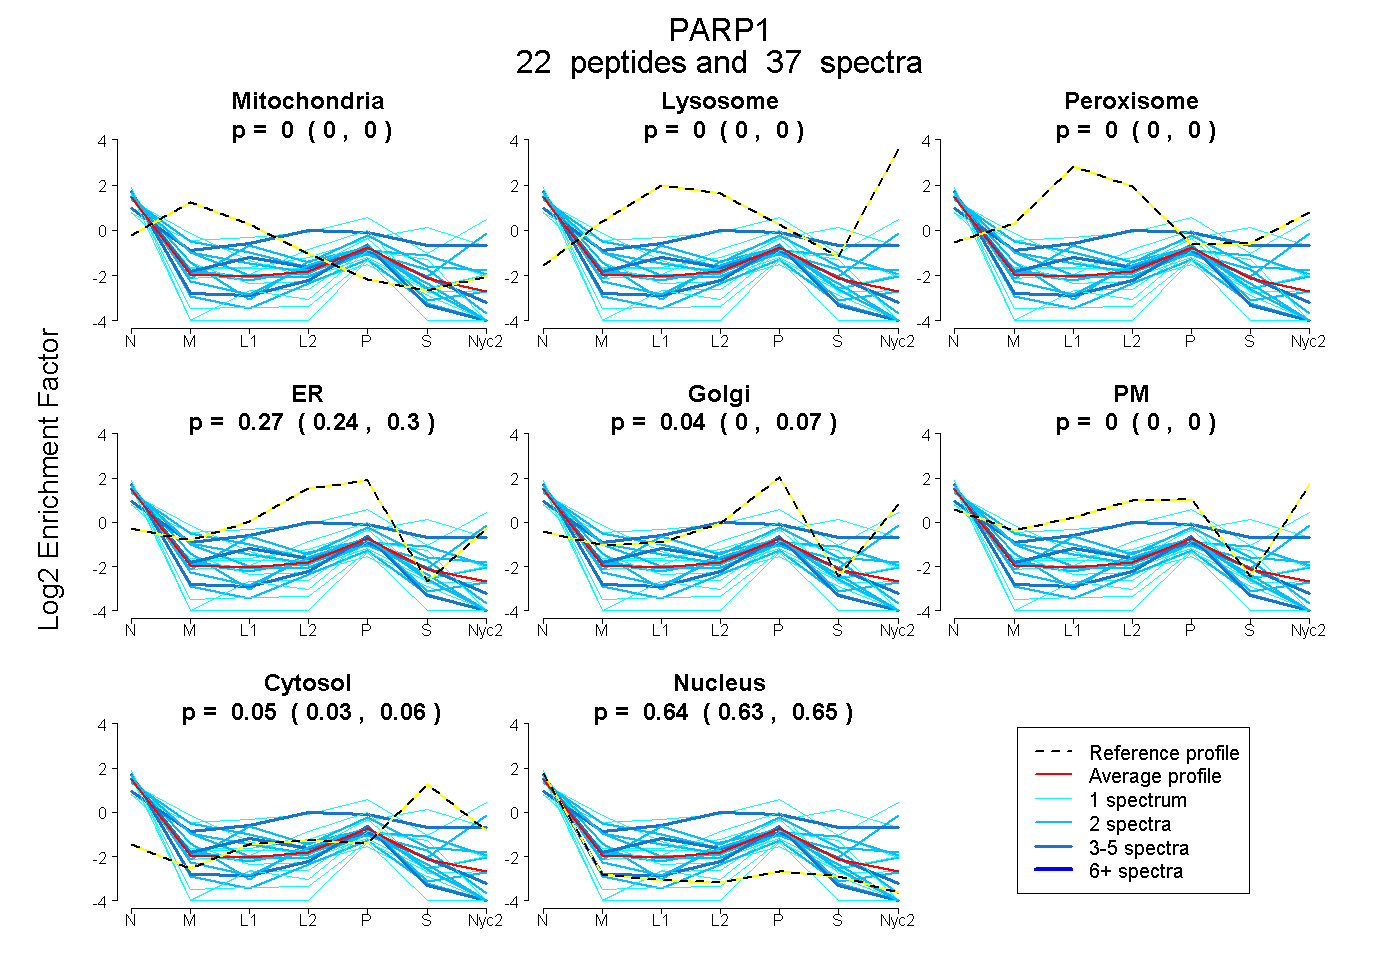
0.000 | 0.000
0.000 | 0.000
0.000 | 0.000
0.240 | 0.301
0.000 | 0.066
0.000 | 0.000
0.034 | 0.056
0.634 | 0.653
1peptide
spectrum
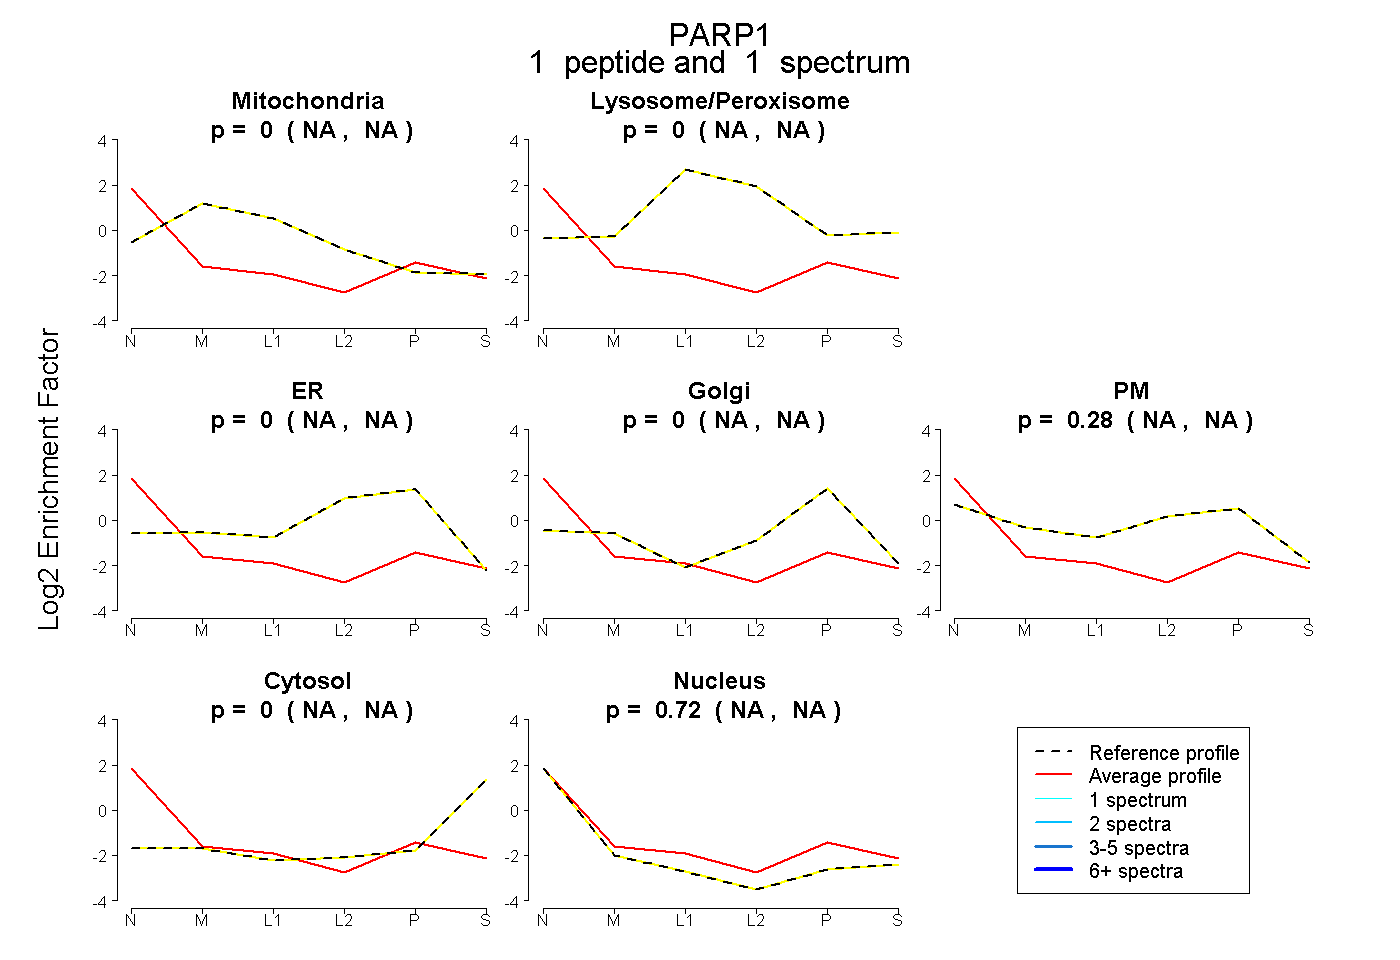
NA | NA
NA | NA
NA | NA
NA | NA
NA | NA
NA | NA
NA | NA
5peptides
spectra
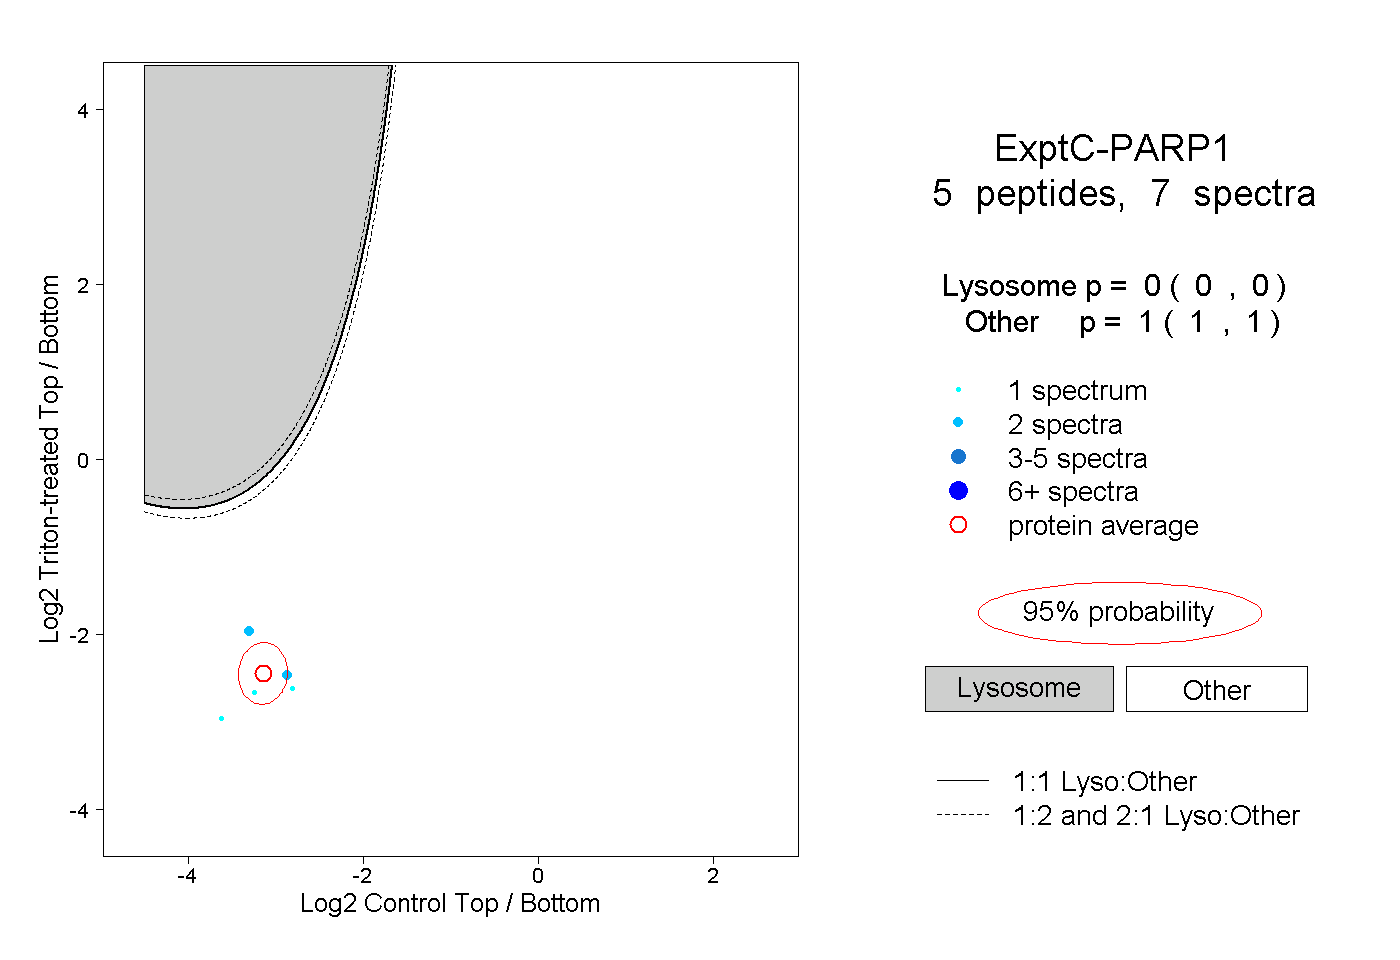
0.000 | 0.000
1.000 | 1.000