3
3peptides
spectra
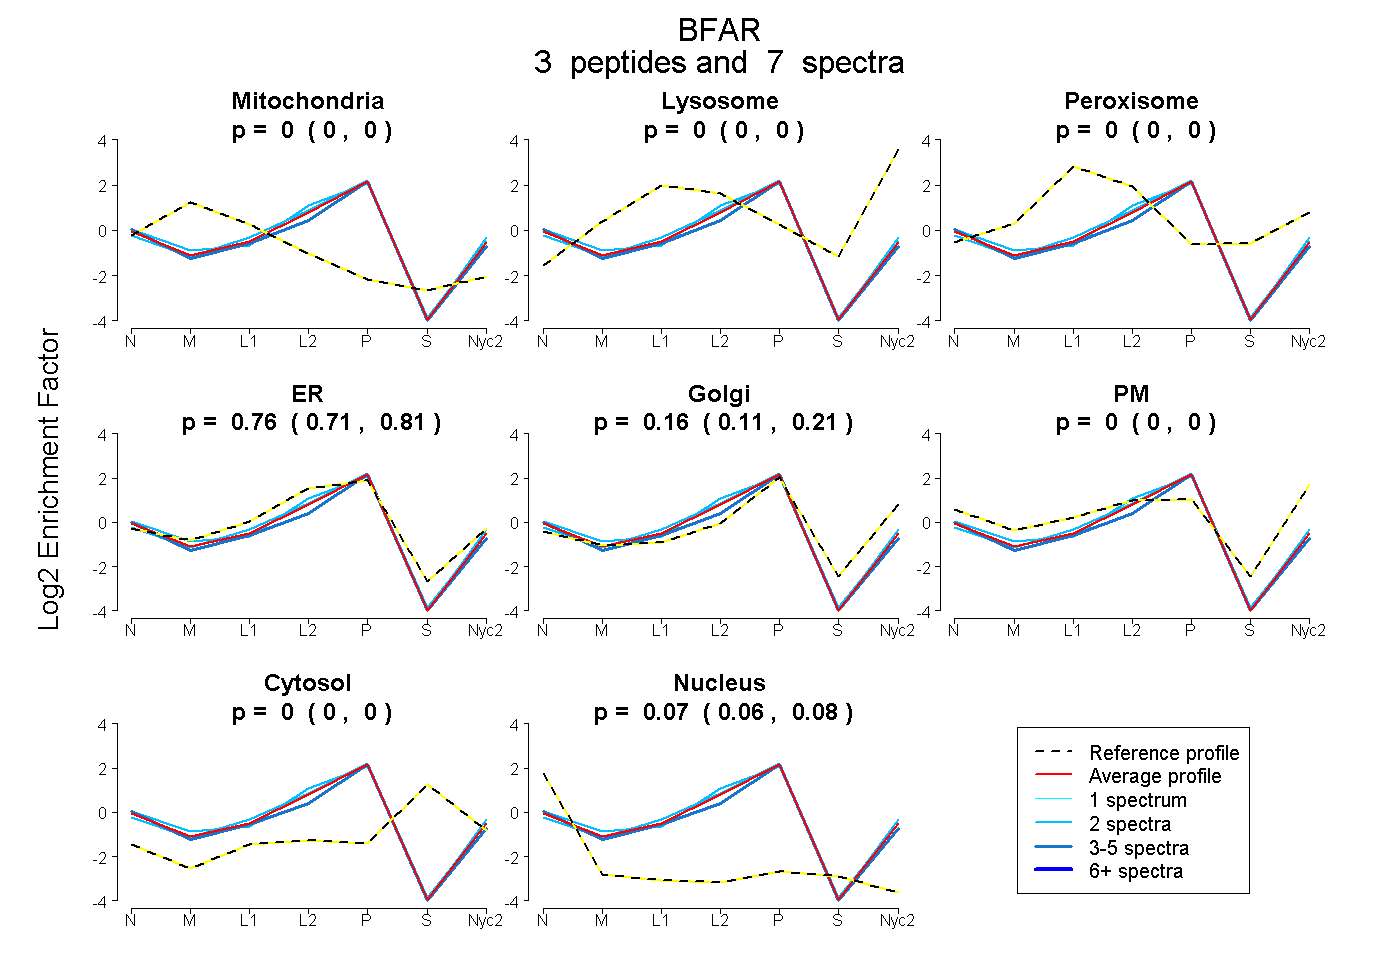
0.000 | 0.000
0.000 | 0.000
0.000 | 0.000
0.706 | 0.805
0.113 | 0.207
0.000 | 0.000
0.000 | 0.000
0.064 | 0.083
3peptides
spectra
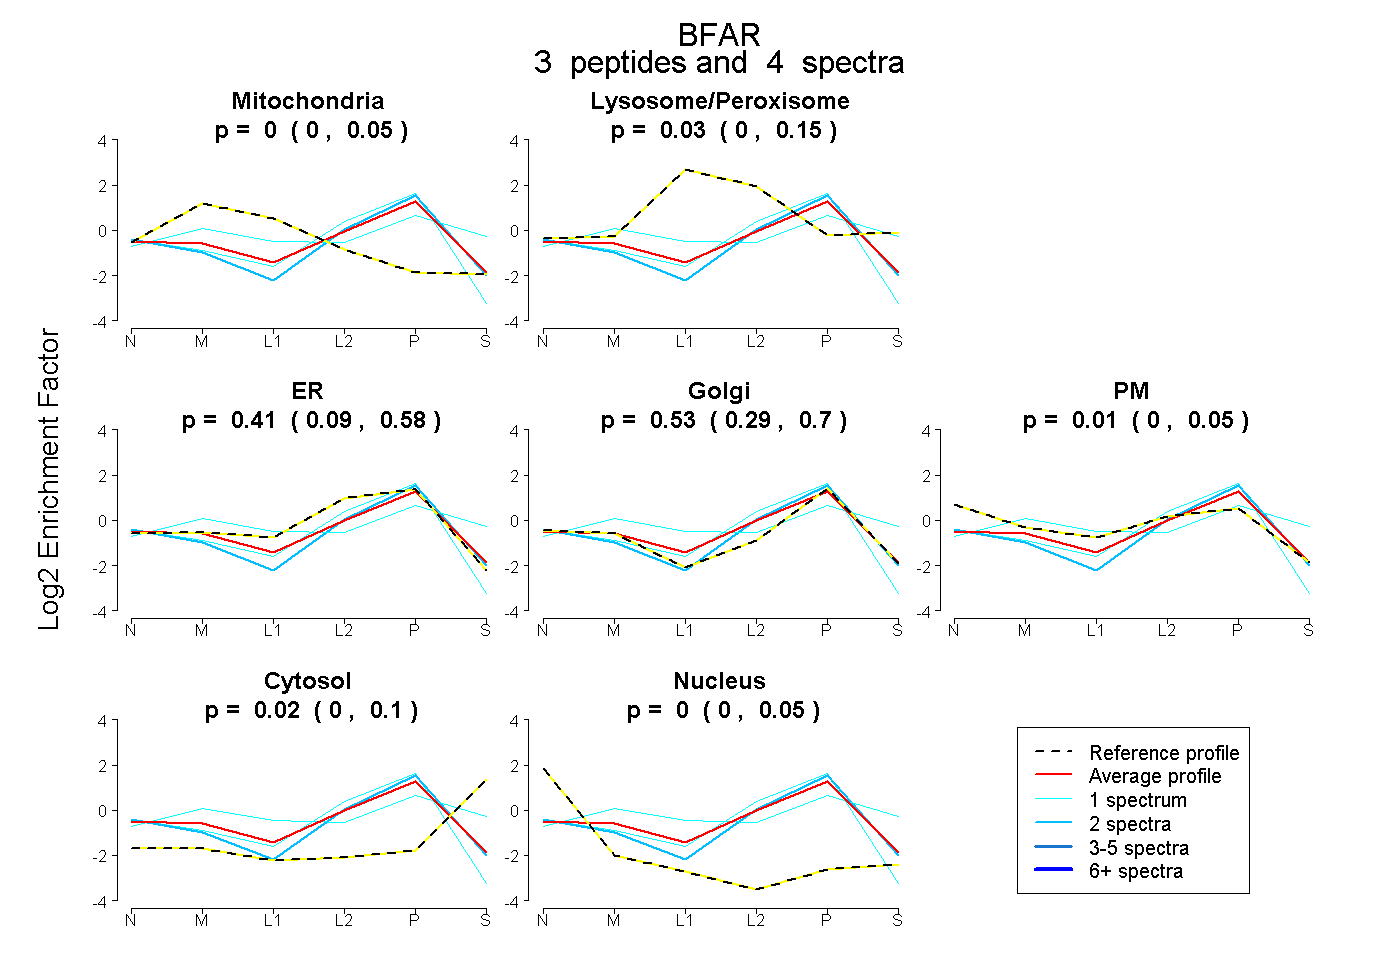
0.000 | 0.049
0.000 | 0.152
0.091 | 0.580
0.291 | 0.695
0.000 | 0.048
0.000 | 0.099
0.000 | 0.050